Domestic equities surged in November following strong economic data, benign inflation, and robust corporate earnings. Overseas equities, particularly in the euro area, followed suit. In fixed income, bond markets rallied on optimism about inflation trends and a potential Fed pivot, resulting in falling yields. Credit investments benefited from narrowing spreads, with investment-grade and high yield sectors gaining. Real assets, including global REITs and infrastructure, delivered positive returns, while oil prices declined due to record U.S. production and weaker Chinese demand. Clean energy rebounded, and gold rose as a hedge against geopolitical uncertainty.
Equities
The 9.1% gain of the S&P 500 in November marked the best month since July 2022 and the fourth best month in 12 years. Investor sentiment was very low heading into the month as concerns over a hard landing led to three consecutive down months, pushing the Index into a correction in late October. Benign inflation readings, coupled with solid economic data and better than expected corporate earnings, led to a sharp rebound for the S&P 500. At the end of the month, the S&P 500 Total Return Index was less than 3% away from its all-time high.
Dating back to 1970, there have been 18 other instances when the S&P 500 gained over 9% in a calendar month. The strong gains foreshadowed continued market momentum.
On average, the index gained 17.0% in the subsequent 12 months, turning in positive performance in 15 out of 18 cases (83% success rate).
Overseas equities followed a similar pattern, with the MSCI EAFE appreciating 9.3%. All developed countries closed the month in positive territory, but it was the euro area (+11.5%) that saw the most significant gains. Inflation in the euro area slowed, finishing the month well below expectations.
Germany (+13.3%), Europe’s largest economy, also benefited from stronger than expected consumer data. While returns were generally strong, non-U.S. equities benefited from weakness in the U.S. dollar. The U.S. Dollar Index was down 3%, its worst monthly return in a year.
In emerging markets (+8.0%), China (+2.5%) again lagged despite efforts by the U.S. and China to improve relations and restore communications.
The meeting between President Biden and Chinese President Xi Jinping was not enough to offset persistent weak sentiment.
Year-to-date, foreign investors pulled $25 billion worth of shares from China’s Stock Connect program, bringing net inflows to lows not seen since the program’s inception in 2015. Capital was rotated into booming markets such as Taiwan (+13.2%) Korea (+16.2%), and India (+7.7%), as investors await more substantial policy support from the Chinese government and signs of a sustainable economic recovery.
Latin America remained a standout region on the back of Brazil (+14.2%) and Argentina (+42.4%), which rose sharply on reports that President-elect Javier Milei was considering dollarizing the challenged economy.
Fixed Income
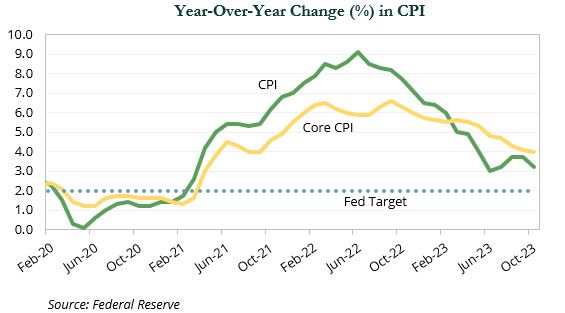
The mid-November release of the October CPI report echoed recent findings. The Fed maintained steady rates early in the month, but following the CPI release, there was a growing market belief that the tightening cycle had ended. Consequently, there was an accelerated anticipation for the commencement of the easing cycle.
Bond markets rallied due to optimism about inflation trends and growing expectations of a Fed pivot. Yields fell in November with the greatest declines occurring at the long-end of the curve. The 90-day T-bill fell 9 bps to 5.4%, while the 2-, 10-, and 30-year parts of the curve each declined 54−55 bps.
Treasuries rallied, but the 9.2% gain in long-dated Treasuries surpassed the 3.8% gain in intermediate-term Treasuries and the 0.4% gain in T-bills.
Credit investments benefited from falling yields and narrowing spreads. Investment-grade and high yield spreads declined 25 bps and 67 bps, respectively, which led to a 6.0% gain in investment-grade corporates and a 4.5% gain in high yield. Leveraged loans—the clear winner over the past year—rose a modest 1.2%.
Real Assets
Real assets were largely positive in November. Global REITs (+10.7%) and European REITs (+17.6%) saw double-digit gains after the European Central Bank paused its record run of 10 consecutive rate hikes. U.S. REITs gained 10.4% as 10-year Treasury yields fell from 4.90% in October to 4.36%.
Digital infrastructure (+19.9%) and self-storage (+15.0) were the top performing U.S. REIT sectors. Global infrastructure (+9.7%) also gained based on expectations that rate hikes would end or reverse course. Infrastructure funds have also benefited from built-in inflation escalators, with contracted cash flows increasing in the months following continual rate hikes.
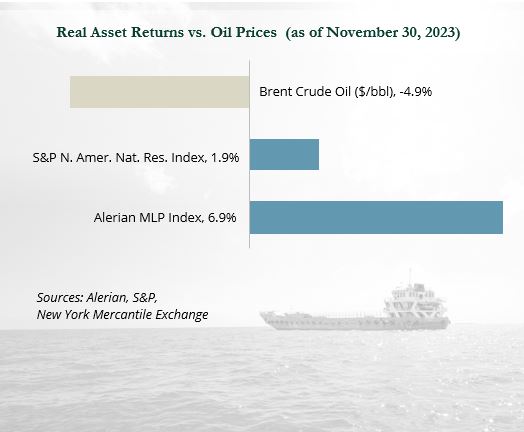 Brent Crude prices fell 4.9% following a 2.7% drop on the last trading day of the month. Record production in the U.S. and weaker demand prospects from China weighed on oil, despite additional cuts announced by OPEC+ members, which now total 2.2 million barrels per day through March 2024. The market did not immediately react to the announcements as they were largely expected and built into forecasts. Further, the voluntary nature of the cuts provided some doubt on the intentions of all OPEC+ members.
Natural gas was down 16.0% on record U.S. production, above average storage levels, and forecasts for a mild winter. Despite the declines in oil and gas, resource equities rose 1.9% as many companies can operate profitably at current prices.
MLPs were up 6.0%, bringing YTD gains to 29.4%. MLP stocks have maintained strong market fundamentals, and were attractive on a yield basis, offering dividends exceeding 7.5%. Additionally, MLPs have benefited from increased volumes and higher barriers to entry as it is difficult to build new products in the sector.
Clean energy (+9.4%) rebounded after three straight down months resulted in a trailing three-month decline of 29.0% through October. There were several positive developments during the month, including the anticipated stabilization of rates and the long-awaited release of new investment tax credit regulations by the IRS and U.S. Department of Treasury. The price of gold increased 2.7%, bringing YTD performance to 16.7%. Gold has fared well YTD as a hedge against rising geopolitical uncertainty.
Indices referenced are unmanaged and cannot be invested in directly. Index returns do not reflect any investment management fees or transaction expenses. Copyright MSCI 2023. Unpublished. All Rights Reserved. This information may only be used for your internal use, may not be reproduced or redisseminated in any form and may not be used to create any financial instruments or products or any indices. This information is provided on an “as is” basis and the user of this information assumes the entire risk of any use it may make or permit to be made of this information. Neither MSCI, any of its affiliates or any other person involved in or related to compiling, computing or creating this information makes any express or implied warranties or representations with respect to such information or the results to be obtained by the use thereof, and MSCI, its affiliates and each such other person hereby expressly disclaim all warranties (including, without limitation, all warranties of originality, accuracy, completeness, timeliness, non-infringement, merchantability and fitness for a particular purpose) with respect to this information. Without limiting any of the foregoing, in no event shall MSCI, any of its affiliates or any other person involved in or related to compiling, computing or creating this information have any liability for any direct, indirect, special, incidental, punitive, consequential or any other damages (including, without limitation, lost profits) even if notified of, or if it might otherwise have anticipated, the possibility of such damages. Bloomberg Index Services Limited. BLOOMBERG® is a trademark and service mark of Bloomberg Finance L.P. and its affiliates (collectively “Bloomberg”). Bloomberg or Bloomberg’s licensors own all proprietary rights in the Bloomberg Indices. Bloomberg does not approve or endorse this material, or guarantee the accuracy or completeness of any information herein, or make any warranty, express or implied, as to the results to be obtained therefrom and, to the maximum extent allowed by law, it shall not have any liability or responsibility for injury or damages arising in connection therewith. Copyright ©2023, S&P Global Market Intelligence (and its affiliates, as applicable). Reproduction of any information, data or material, including ratings (“Content”) in any form is prohibited except with the prior written permission of the relevant party. Such party, its affiliates and suppliers (“Content Providers”) do not guarantee the accuracy, adequacy, completeness, timeliness or availability of any Content and are not responsible for any errors or omissions (negligent or otherwise), regardless of the cause, or for the results obtained from the use of such Content. In no event shall Content Providers be liable for any damages, costs, expenses, legal fees, or losses (including lost income or lost profit and opportunity costs) in connection with any use of the Content. A reference to a particular investment or security, a rating or any observation concerning an investment that is part of the Content is not a recommendation to buy, sell or hold such investment or security, does not address the suitability of an investment or security and should not be relied on as investment advice. Credit ratings are statements of opinions and are not statements of fact. FTSE International Limited (“FTSE”) © FTSE 2023. FTSE® is a trade mark of the London Stock Exchange Group companies and Is used by FTSE under license. All rights in the FTSE indices and / or FTSE ratings vest in FTSE and/or its licensors. Neither FTSE nor its licensors accept any liability for any errors or omissions In the FTSE indices and / or FTSE ratings or underlying data. No further distribution of FTSE Data is permitted without FTSE’s express written consent. Indices referenced are unmanaged and cannot be invested in directly. Index returns do not All commentary contained within is the opinion of Prime Buchholz and is intended for informational purposes only; it does not constitute an offer, nor does it invite anyone to make an offer, to buy or sell securities. The content of this report is current as of the date indicated and is subject to change without notice. It does not take into account the specific investment objectives, financial situations, or needs of individual or institutional investors. Some statements in this report that are not historical facts are forward-looking statements based on current expectations of future events and are subject to risks and uncertainties that could cause actual results to differ materially from those expressed or implied by such statements. Information obtained from third-party sources is believed to be reliable; however, the accuracy of the data is not guaranteed and may not have been independently verified. Performance returns are provided by third-party data sources. Past performance is not an indication of future results.