Volatility Rings in the New Year
It was a tumultuous first month of the year, as rising inflation and a shift in the Fed’s monetary policy stance caused extreme volatility across most markets. In the wake of strong market performance to end 2021—predominantly attributable to the strength of mega cap stocks—losses within equities have been broad-based month-to-date (MTD). The Russell 3000 Index (−9.4% through January 26th) has retraced all of its gains from the second half of 2021.
Losses were sharpest among growth equities, as reflected in the 13.7% MTD decline of the Russell 3000 Growth Index. Within the growth category, investors showed a clear preference for quality as extreme growth and speculative names lagged. Value stocks – with a 4.7% loss MTD for the Russell 3000 Value Index – outperformed growth stocks. The highest multiple companies and those without profits have drastically underperformed their growth-at-a-reasonable price peers, regardless of potential future growth rates.
Tech stocks were remarkably weak, with the NASDAQ entering into a correction. All six FAANGM stocks posted double-digit drawdowns and lagged the S&P 500 in the MTD period.
While it is difficult to place labels on long/short equity hedge fund performance over short periods, it is clear performance is experiencing similar levels of disparity and volatility as equity markets. However, we note several key themes:
- Early indications show panicked selling from retail investors.
- Newly public companies formed either via IPO or special purpose acquisition companies (SPACs) have been sold en masse with little distinction between companies.
- Volatility has largely been equity-centric and the impact on credit managers has been less severe.
Natural resources equities traded higher on oil price gains and investors seeking inflation protection. The crude market was already notably tight at the start of the month due to a combination of strengthening demand – which has been resilient to both the Delta and Omicron Covid waves—and under-investment in supply. Brent crude eclipsed $90 per barrel on January 27, 2022—the highest level since 2014. Oil prices advanced 15.7% MTD and energy stocks, which are up 17.5% collectively, were the only S&P 500 sector in positive territory on a MTD basis as of January 26, 2022. Geopolitical concerns in the Middle East and Ukraine/Russia have fueled the recent run-up in prices.
While there are other factors influencing early volatility, the market’s primary concern is the ongoing inflationary pressure in the economy and a meaningful shift in monetary policy. Much like the term “transitory” to describe inflation eventually wore thin, the word “pivot,” referring to monetary policy, understates the sharp shift in the Federal Open Market Committee’s (FOMC) stance.
Inflation Dynamics at Play
The inflationary pressure in the economy has been well documented. While the Federal Reserve’s dual mandate is to promote full employment and price stability, the Fed has focused more on the labor market throughout the COVID-19 pandemic. The unemployment rate fell to 3.9% in December 2021. Meanwhile, the FOMC Summary of Economic Projections released in December showed the Fed expects further improvements in labor markets with unemployment falling further to 3.5% before settling to a long-run average of 4.0%. With labor markets showing signs of healing, the Fed has turned its attention to inflation.
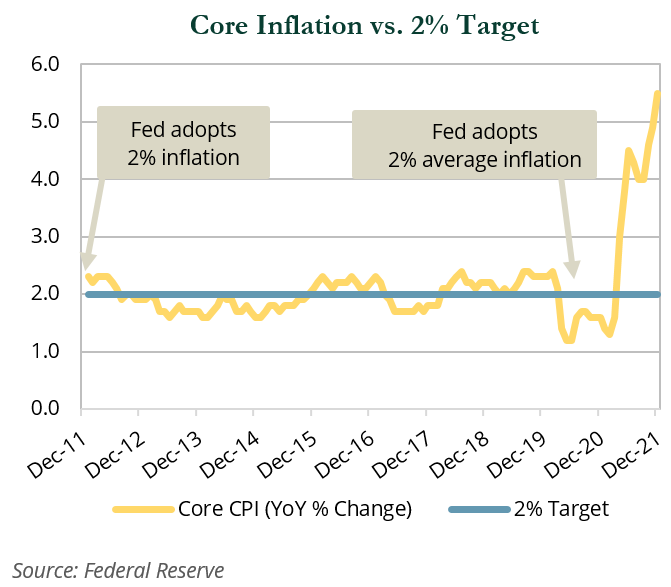
As shown in the following chart, core inflation remains well above the Fed’s target. (Core CPI is the Fed’s preferred gauge; core PCE CPI—excluding food and energy—has not yet been released for December, but tends to be approximately 30 bps lower.)

Policy Response
The Fed pivot began in September 2021. From September to December, the Fed meaningfully altered the language in its policy statements and became significantly more hawkish. Major steps from each monthly meeting included the following:
- September – Pulled forward one rate hike into 2022 and continued to prepare markets for a tapering of bond purchases
- November – Announced bond purchase tapering would begin in the middle of the month and possibly conclude earlier than expected
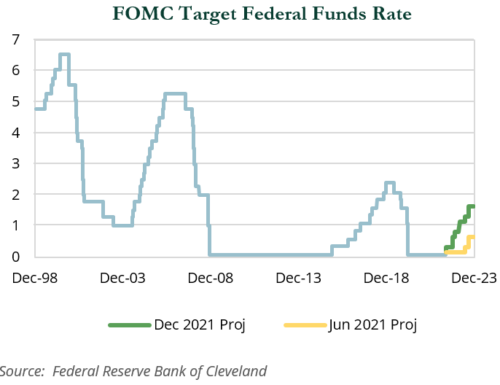
- December – Announced tapering of bond purchases would increase and be finished by March. Three rate hikes in 2022 were projected
The next chart shows the change in the expected tightening cycle.

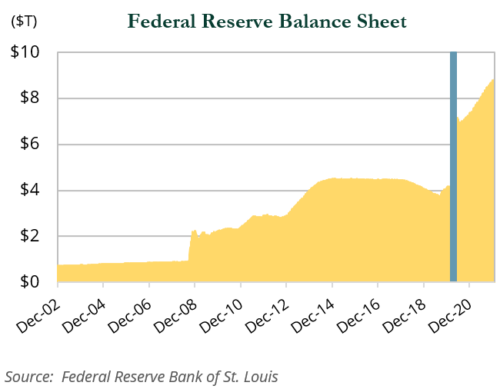
The actions in the fourth quarter of 2021 contributed to significant volatility in capital markets and rising rates. However, damage continued into January following the release of the minutes from the December meeting on January 5th and the press conference/policy statement following the January 25-26th FOMC meeting. Minutes from the December meeting revealed for the first time that participants discussed reducing the size of the approximately $9 trillion balance sheet.

The policy statement from the January FOMC meeting was hawkish and indicated tapering would end at the beginning of March. In his post-meeting press conference, Chair Jerome Powell spoke to the benefits of a rate hike in March 2022. Markets priced in a rate hike at the next meeting and currently expect four, possibly five, hikes this year.
The Fed also released guidance on how it would begin to normalize the size of the balance sheet. The process could start as soon as March, which means that in five weeks’ time we could see:
- The end of bond purchase tapering,
- The first rate hike in an uncertain tightening cycle, and
- The start of a reduction in the balance sheet.
With an eventful month of March closing in, markets are grappling with uncertainty, causing equity and rate volatility to spike.
What’s Next?
Interest rate markets are pricing in at least four rate hikes in 2022. The yield curve is flattening, indicating a fear that the Fed will hurt the current expansion. Following are other important questions to consider:
- Is the Fed making a policy mistake by over-tightening in a period when growth is slowing and inflation may be peaking?
- Will the Fed raise its 2.5% long-run fed funds rate forecast, allowing rates to move even higher?
- Will balance sheet normalization cause problems in the repo market like it did in September 2019?
These are important questions, and there are many more. This uncertainty is likely to manifest as increased volatility. This may be uncomfortable over the short-term, but we believe it is critical for clients to maintain a long-term focus during short-term fluctuations. We continue to advise patience and adherence to the plan designed for long-term success. Do not be afraid to take advantage of investment opportunities that can often come from short-term volatility.