The global pandemic entered its second year in 2021. Despite the rapid rollout of several vaccines at the end of 2020 and concerted efforts to immunize the population, vaccination rates vary widely across the globe. Two variants of the original SARS-CoV-2 strain emerged—delta and omicron—and spread quickly across the world. When infection rates spiked at various points throughout the year, many countries implemented restrictive measures to stem the rise, but, by and large, global economies remained opened in 2021.
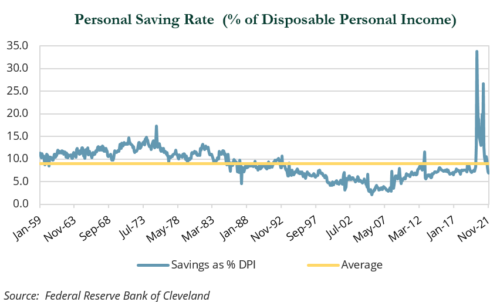
Inflation reared its head in March due to a combination of fragile supply chains and robust demand (consumer spending was propelled higher from falling unemployment, rising wages, and high savings rates). Inflation remained elevated throughout the remainder of the year, which benefited a number of asset classes. Assets geared toward offering inflation protection (i.e., commodities, TIPS, real estate) performed very well, while corporate earnings accelerated and propelled equity markets higher.
 Despite a resilient consumer and corporate sector, policy makers grew more concerned about inflation. As described below, the Federal Reserve meaningfully adjusted monetary policy guidance during the fourth quarter. On the fiscal side, Democrats used the budget reconciliation process to pass additional relief packages, but were met with resistance in passing the Biden administration’s ambitious spending package. These factors caused yields to rise, dampening the returns of most fixed income asset classes outside of high yield and leveraged loans.
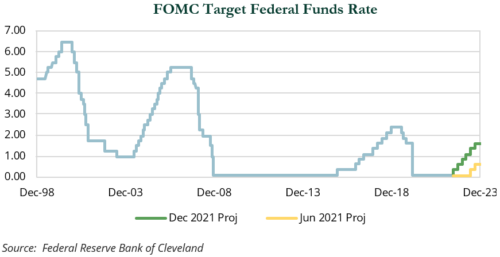
In its March 2021 Summary of Economic Projections, the Federal Open Market Committee forecasted no changes in interest rates for 2021–23. As inflationary pressure accelerated during the year, the Fed began to prepare markets for bond purchase tapering as well as rate hikes in 2023. The Fed pivot was completed over the November/December meetings, when the Fed announced a more rapid conclusion to tapering and more aggressive rate-hiking cycle.
Heightened inflationary pressure caused real assets to outperform broader markets, with energy equities (+54.4%), real estate (+46.0%), diversified resource equities (+39.8%), and commodities (+27.0%) delivering outsized returns during the year.
In real estate, strong performance spanned most sub-sectors as investors sought protection from rising inflation and exposure to market segments with accelerating secular tailwinds, including housing (61.5%) and logistics/industrial (57.6%).
 A lack of skilled builders and restrictive zoning continued to drive a chronic undersupply in single-family and for-rent housing, which were exacerbated by higher input costs and supply chain disruptions.
The industrial/logistics sector outperformed as demand continued to outstrip supply and rental rates continued to increase. Growing demand, faster ecommerce delivery times, and the shift from “just in time” to “just in case” supply chain models increased the need for more warehouse space while construction costs grew. Some cyclical sectors experiencing a recovery in fundamentals such as retail (51.9%) also outperformed, particularly regional mall stocks, which increased 92.1%.
Energy equities (+54.4%) and natural resource equities (+39.8%) rose on higher commodity prices, strengthening fundamentals, increasing sector dividends, and improved balance sheets. The move higher in commodities (27.0%) was led by industrial metals (+30.2%) and energy commodities (51.9%), most notably in crude (+55.0%). Brent crude peaked near $86 per barrel in October and finished the year at $77.80 as global demand returned to 2019 levels. On the supply side, OPEC+ continued to hold back production of approximately 5 million barrels per day. U.S. shale producers were also slow to add new production as investors demanded companies focus on returning capital and increasing dividends rather than any significant growth plans.
Precious metals was the clear laggard in the commodity complex as gold fell 3.5%. Gold has historically performed well during periods of high inflation (above 6%) and underperformed during periods of low or moderate inflation. Breakeven rates ended December pricing in some moderation of inflationary pressures over time. The five-year breakeven rate finished at 2.9% and the 5×5 forward breakeven rate, which measures inflation expectations for the five-year period that begins five years from year end, closed at 2.3%.
In addition to positive returns from most real asset categories, equity markets also shined in 2021. The U.S. was once again the best performing equity region. The S&P 500 gained 28.7% and the broader Russell 3000 Index rose 25.7% for the year versus a 11.3% gain for the MSCI EAFE Index and a 2.5% loss for MSCI EM. Calendar year performance represented the third consecutive year of 20%+ gains for the Russell 3000 Index, trailing only the five-year streak in 1995–99. The strong U.S. performance was driven by robust earnings growth coming off COVID lows. For the full calendar year, the earnings per share for the Russell 3000 Index were estimated to have grown by just over 50%. The trailing P/E multiple for the Index declined from 27.5x at the end of 2020 to 23.2x at the end of 2021.
Sector leadership saw a sharp rotation relative to 2020. The three best performing sectors in 2021 were energy (+54.2%), real estate (+37.6%), and financials (+34.0%), which benefited from the tailwind of the economic reopening and fears of higher inflation. The same three sectors were the worst performers in 2020, all finishing the prior year in negative territory.
Apart from energy, real estate, and financials, IT (+29.6%) was the only other sector that finished ahead of the broad index in 2021. The worst performers were defensive utilities (+16.0%) and consumer staples (+17.1%) stocks, which did not keep up with the broad index in a sharp up market.
Growth narrowly edged out value stocks for the year; the Russell 3000 Growth Index gained 25.8% versus 25.4% for its value counterpart. Over the first five months of the year, value outpaced growth by almost 1,300 bps on optimism about the economic reopening. However, slowing vaccination rates and new coronavirus variants fueled a reversal that saw growth stocks beat value by almost 1,700 bps from June to November. Value surged back in December to close the gap as investors’ worst fears about the omicron variant failed to materialize.
 Large cap stocks outpaced their small cap counterparts for the fifth straight year. The Russell 1000 Index gained 26.5% versus 14.8% for the Russell 2000 Index, marking large caps’ widest margin of outperformance since 1998. The healthcare sector accounted for about two-thirds of the return difference between the two indices. Small cap healthcare stocks, roughly half of which are biotech companies, sold off 17.0% for the year, while large cap healthcare names gained 23.7%.
The outperformance of large and mega caps in recent years has caused significant concentration within the top 10 holdings of the S&P 500. At year-end 2021, the weighting of the top 10 names stood at 30.5% versus
18.2% at the end of 2016. According to J.P. Morgan, the top 10 names also traded at a significant forward price/equity premium to the rest of the Index at year-end 2021 (33.2x vs. 19.7x). However, this was largely driven by Tesla, which finished the year as the fourth largest weight in the Index.
Currency played a role in the underperformance of non-U.S. equity markets relative to the United States. The only developed market currency to appreciate against the U.S. dollar (USD) was a modest gain in the Canadian dollar (+0.9%). While there were a handful of emerging markets (EM) currencies that appreciated—Ukraine hryvnia (+3.9%), Israeli shekel (+3.2%), Chinese yuan (+2.6%), Taiwanese dollar (+1.6%), and Vietnamese dong (+1.3%)—the vast majority of EM currencies depreciated against the USD.
Developed non-U.S. stocks notched double-digit returns (+11.2%), but failed to keep pace with their domestic counterparts. In local terms, the MSCI EAFE Index rose 18.6%. Equity returns varied by country, but European names generally outpaced those in the Asia-Pacific region. Hong Kong (‒3.9%) and Japan (+1.8%) were among the worst performing countries, the latter of which was driven by currency weakness. The yen fell over 10% versus the USD due in part to the likelihood that the Bank of Japan would keep interest rates unchanged for the foreseeable future.
Sector and style leadership followed a similar pattern as U.S. markets. The MSCI EAFE Growth and Value Indexes closed the year just 40 bps apart, with the Growth Index finishing slightly ahead. The narrow spread masked the volatility of style leadership during the year, with strong performance from value bookending a period of growth leadership. The energy sector (+22.9%) again led the way with IT (+20.9%) close behind. Utilities closed the year flat, while communication services (‒5.7%) was the only sector to register a loss for the year.
Emerging markets finished down 2.5% after a tumultuous year. Volatility was heightened across several markets; however, China (‒21.7%) was the most pronounced headwind. Investor sentiment remained unsettled following months of swift, and at times severe, regulatory action.
 Initially, tech and ecommerce bore the brunt of weakness, but regulatory pressures spread more broadly. Chinese markets were rattled by the well-publicized crackdown in the for-profit education sector and the troubles of property developer Evergrande and concerns over its ability to meet debt obligations. Chinese equity markets were pressured further by signals of a slowdown in consumer spending toward year-end. Elsewhere, smaller markets such as Brazil (‒17.2%) and Turkey (‒27.8%) also garnered increased attention. In Brazil, rising inflation and political uncertainty weighed on sentiment, while unconventional central bank policy amidst double-digit inflation rattled equity and currency markets in Turkey. Dispersion between the top and bottom performing countries was wide. India (+26.6%) was a bright spot as the economy boomed after recovering from a devastating second wave of COVID-19 as consumers spending rapidly increased.
From a sector perspective, cyclical segments of the market, including energy (+22.1%) and materials (+9.6%), were among the top performers. IT (+10.2%) was also a positive contributor on the back of semiconductors, which are more cyclical in nature. Consumer discretionary and communications services were the worst performers, which is primarily a reflection of the volatility in China. Weakness in Alibaba (‒41.7%) and Tencent (‒19.2%), which remained among the top five benchmark constituents, was a material drag on performance within these sectors. Stylistic leadership reversed sharply for the year. The MSCI EM Value Index outperformed the MSCI EM Growth Index by approximately 1,200 bps.
Hedge funds also felt the growth/value rotation at the start of 2021. The year began chaotically, as a retail-driven short squeeze forced many long/short managers to rapidly cover shorts and lock in losses for a number of consumer names in January. Most notably, popular short GameStop saw its stock price jump from around $18 to more than $350 in a very short period as a group of retail investors organized a stock price run-up on digital trading platforms. This unprecedented incident caused some concern that it could bleed into other widely held short positions. Some hedge fund managers adjusted their approaches to shorting, placing a greater emphasis on catalysts and market liquidity. A few managers temporarily reduced the number of single-name shorts in their portfolios in favor of market indices in an effort to avoid further short losses. This rotation to less individual short names proved temporary and short books were built up in the second half of the year.
Equity market leadership oscillated between value and growth, but high multiple and more speculative pockets of technology and biotech struggled, creating headwinds for many managers. Managers that had benefited from the run-up in growth in 2020 struggled in 2021, particularly in the fourth quarter. Many of the largest losers for 2021 were some of the largest COVID winners in 2020 and included stocks such as Peloton (‒76.4%), Zoom (‒45.5%), and DocuSign (‒31.5%). Other tech/media/telecom names such as Salesforce and Meta Platforms (formerly Facebook) experienced pullbacks in the fourth quarter, but finished the year in positive territory. The dispersion in the market proved profitable for a number of long/short managers that were able to take advantage of the trading opportunities. Long-side winners Xilinix, IHS Markit, and Microsoft jumped 45–50% for the year. Other, more idiosyncratic names such as Builders FirstSource and WillScot Mobile Mini Holdings shot up 110.0% and 76.3%, respectively, as they benefited from consolidation and being able to pass on supply chain cost increases to their end customers.
A market focused on earnings quality created opportunities for short sellers. Many took advantage of the new issue market created by the boom in special purpose acquisition companies (SPACs) and direct listings in 2020 and early 2021 to profitably short low quality companies.
Credit-focused hedge fund managers performed well overall, largely besting the high yield market. Default rates remained low, but accommodating credit markets created ample opportunities to profitably
exit credit investments initiated in 2020. Many managers began closing out positions in longstanding distressed investments such as Steinhoff and Puerto Rico following a series of positive events. Merger-arbitrage disappointed as a strategy. While deal volumes were up overall, complex deals like Willis Towers Watson/Aon failed to transpire due to regulatory headwinds. Safer deals moved forward, but offered minimal spread opportunities for arbitrageurs.
Through the first three months of 2021, U.S. private equity deal-making had already reached a record annual deal value. Favorable tailwinds in 2021 helped firms close 295 funds and raise a combined $237.7 billion through September 30, 2021. This record-setting deal activity meant firms were drawing down and deploying capital quicker. Traditional five-year investment periods were compressed into two or three years, causing managers to come back to market more quickly. While deal activity has been robust, deal exits were equally healthy, with total exits through September 30th already 50% more than the next highest full year (2018).
Bond markets grappled with inflation, the Fed pivot, and the threat of a growth slowdown from the new COVID variants. Yields rose over the course of the year, reflecting inflation concerns and the change in Fed policy. However, the curve flattened, reflecting growth concerns from the emerging COVID variants. The Bloomberg Barclays U.S. Aggregate Index fell 1.5% in 2021, marking its fourth negative year over the past three decades. Returns declined primarily due to weak U.S. Treasury returns—intermediate Treasuries fell 1.7% in 2021 and long Treasuries declined 4.6%—but the remaining subcomponents of the Index were down approximately 1.0%.
Credit spreads were tight through much of the year, particularly in investment-grade (IG) corporates. IG corporates entered the year trading 96 bps over Treasuries with comparable maturities and ended the year trading at 92 bps over Treasuries. IG corporates fell 1.0% in 2021, which is the seventh negative year over the past 30 years. The only areas of credit that did well were high yield and leveraged loans. These sectors rose 5.3% and 5.4%, respectively, as the demand for income and the search for yield fostered risk taking in fixed income portfolios.
Amid this backdrop, the traditional 70/30 portfolio—70% domestic equities (S&P 500)/30% fixed income (Bloomberg Barclays Aggregate)—rose 19.5% in 2021. This mix outpaced the 15.6% return of a more broadly diversified portfolio, which incorporates non-U.S. developed and EM equities, private equity, real assets, hedge funds, and non-U.S. bonds. Diversified portfolios were hurt by non-U.S. stocks as developed international (+11.3%) and EM (‒2.5%) lagged U.S. equities (+28.7%). Additionally, long Treasuries (−4.6%) and non-U.S. bonds (−9.7%) lagged the Bloomberg Barclays Aggregate Index (−1.5%).
Outlook
There are a number of important questions investors are asking at the start of 2022:
- How will China’s growth dynamics and regulatory crackdowns impact global macro prospects?
- Will central bank efforts to respond to inflation lead to a policy mistake or a recession?
- Will inflationary pressure build in 2022 like it did in 2021?
- What impact will these new variants—and any more that emerge—have on the global recovery?
- Will the dispersion of responses by regions and countries lead to even greater uneven recoveries?
- Will corporate profit margins and earnings be resilient going forward?
- Will returns be above expectations or will they disappoint?
- The common denominator is uncertainty, and, as we’ve repeated many times before, markets hate uncertainty.
U.S. equities capped a stellar year and valuations ended the year lower than they were a year ago. We note that volatility measures (the VIX for the S&P 500 and the MOVE Index for Treasury rates) are elevated and remain above pre-pandemic levels. While this suggests markets have priced in uncertainty, it is impossible to determine the direction markets will take or who the winners and losers will be. Two of our long-held guiding principles are (i) diversification is an investors greatest tool against uncertainty and (ii) volatility often presents opportunities. We remain steadfast in our commitment to develop an appropriate plan with each client and to execute on that plan when opportunities arise.