Inflation has been a topic of much speculation since the outset of the COVID-19 pandemic. In our April Investment Perspective, The Inflation Debate, we explored some of the factors behind rising inflation expectations, including the historic level of stimulus that has been infused into the system worldwide.
In the following report, we examine some of the factors impacting current expectations as well as the viability of curtailing the effects of inflation through diversification.
Inflation Year-To-Date
The combination of massive demand and supply shocks has resulted in persistent elevated inflation year to date. Rapid reopening of the global economy and massive fiscal and monetary stimulus have created an unprecedented recovery in demand. On the supply side, significant labor shortages, low inventories, fragile just-in-time supply chains, extreme weather, and geopolitical events have created an equally significant supply shock.
October’s headline CPI print of 6.2% marked the sixth straight month with an inflation print of 5% or greater. Even when volatile food and energy prices are removed, CPI remained elevated at 4.6% as of October 31st.
While elements of the demand and supply shocks are likely to abate in the months ahead, the risk of more durable inflation has increased. Factors that could impact this going forward include continued stimulus, pandemic-induced structural shifts in global supply chains, and an undersupplied housing market. The potential that the inflation experienced to date could turn into a perpetual loop of wage and price increases also remains a threat.
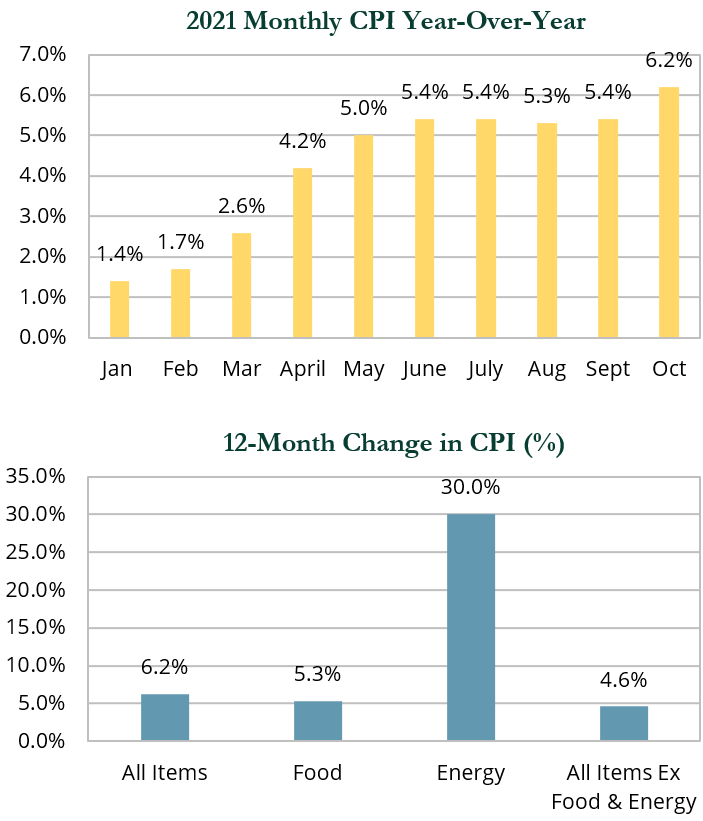
Source: Bureau of Labor Statistics
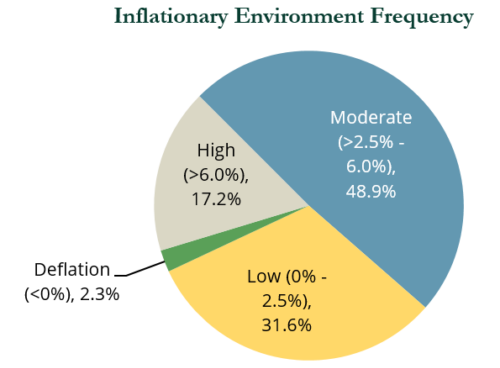
While inflation is top of mind for many investors and consumers, the absolute level and duration of inflation experience to date is not extreme compared to previous periods of inflation.
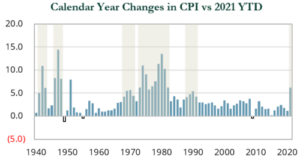
Source: ADD
Further, in addition to embedded protection in diversified portfolios there are other positives factors to consider:
- Deflation risk, which may be more difficult to reverse than inflation, appears to have been minimized.
- A limited period of higher inflation may boost wages for low-paying jobs, while supply chain shocks could potentially be short-lived.
- Despite higher inflation year-to-date through October, real GDP growth remains robust in 2021 with the exception of the third quarter, when spread of the Delta variant slowed activity.
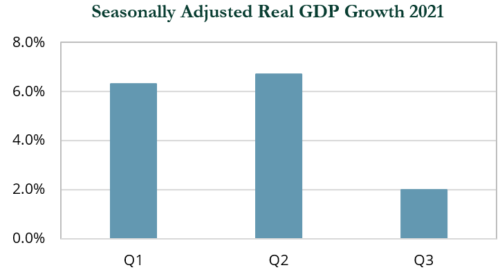
Source: Bureau of Labor Statistics
Year-to-date, real assets and U.S. equities have outperformed amidst higher inflation. Within broader equities, sectors with exposure to real assets performed well.
Energy was by far the best performer while real estate stocks also handily outpaced the broad market. Gold, which tends to do best during periods of high—not moderate—inflation, was the worst performing asset class. Core bonds, which hedge against deflation as opposed to inflation, also sold off.
Protection in a Diversified Portfolio
A diversified portfolio may offer protection against the impacts of persistent moderate-to-high inflation.
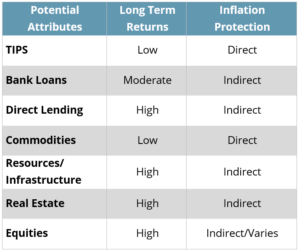
Real Assets
- Resource equities and commodities, including precious metals, energy, industrial metals, paper and products, and agriculture, may provide direct exposure to increasing input costs.
- Real estate and infrastructure may capture higher rents and CPI increases (mandated or otherwise).
- Infrastructure today includes many utilities (water, gas, multi), select telecom, communications, and producing renewables with inflation price escalators.
- Real estate and infrastructure may benefit from higher replacement costs and barriers to entry or, in the case of infrastructure, an asset or company’s quasi-monopolistic position in a given market.
- Gold has historically performed well during periods of high inflation (>6%), but has underperformed during periods of moderate inflation.
Fixed Income
- TIPS, which have principal adjustments directly tied to CPI, may provide direct protection.
- Short duration 0-5 year TIPS have historically shown the highest correlation to CPI.
- Bank loans have coupons that adjust higher with interest rates, which may provide indirect protection.
- Direct lending (like bank loans) have floating-rate coupons that move higher with interest rates, which have the potential to provide indirect protection and attractive return prospects.
December 1970 – October 31, 2021
- Prior to the early 1990s, a majority of the REIT universe consisted of mortgage and hybrid REITs. Today, the REIT sector is dominated by equity REITs, which typically have indirect inflation-hedging attributes.
- TIPS, which have the potential to provide direct protection against inflation, are not shown above given their more recent inception dates.
- Infrastructure only emerged as an accessible asset class in the last 10 plus years, so data is not available to include in the analysis.
U.S. Equity
- Historically, U.S. equities performed well in periods of moderate inflation. When inflation ranged from 2.5–6.0%, the S&P 500 posted average real returns of 10.2%. However, when inflation exceeded 6.0%, the index generated negative real returns.
- S. equities’ sensitivity to inflation has varied significantly by market cap and style. Historically, value stocks—particularly small cap value—fared better during periods of moderate and high inflation.
- Value stocks typically carry higher leverage and benefit when higher inflation erodes the real cost of debt. Value stocks also tend to be shorter duration assets and less sensitive to increases in interest rates. If higher inflation results in higher interest rates, as was the case in 1970s, it should be a tailwind for value stocks relative to their growth counterparts.
- Value indices tend to have greater exposure to companies holding real assets on their balance sheets, such as resources and real estate. However, the representation of these sectors in broad indices has gone down over time. For example, at their peak in the early 1980s, resource stocks made up roughly one-third of the S&P 500; as of October 31, 2021, their combined weighting stood at 5%.
- Growth stocks may have greater pricing power than value stocks and may be in a better position to pass higher input costs on to customers. Growth companies also tend to have higher gross margins and may be able to absorb an increase in costs better than their value counterparts. Case in point, 44% of Russell 2000 Growth Index constituents had gross margins above 40% versus 29% of Russell 2000 Value Index constituents.
Should an uptick in inflation result in greater dispersion of performance among sectors and individual stocks, it may create opportunities for best-in-class active managers. Active managers may lean into companies relatively insulated from inflationary pressures and sidestep companies most exposed to inflation.
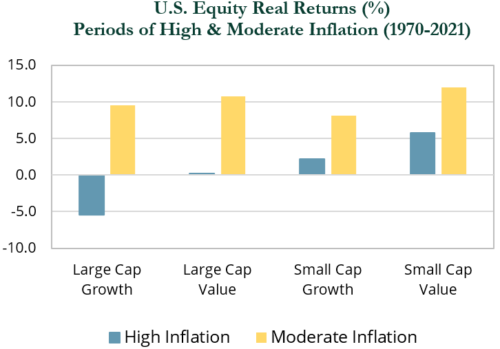
Note: Russell 1000 and 2000 style indices from January 1979 to present; Kenneth R. French style indices prior to 1979. Analysis is through October 31, 2021. High inflation is defined as y/y CPI reading above 6.0%; moderate inflation is defined as y/y CPI reading between 2.5% and 6.0%
Source: U.S. Bureau of Labor Statistics, Kenneth R. French Data Library at Dartmouth Tuck School of Business, Russell
Conclusion
The persistence of elevated inflation has been challenging for investors, particularly after three decades of relatively benign inflation. Some of the current drivers may be transitory (e.g., supply chain issues, container ship costs, chip shortages), while others may prove to be stickier (e.g., housing and wages). In this environment, the nature of the game has changed somewhat and requires an update to the playbook.
There are asset classes that can provide direct and indirect protection against inflation. Predicting the degree and path of future inflation is challenging. We believe the best defense continues to be a well-diversified portfolio and thinking outside of the box in terms of asset class selection.
Appendix
Sources of Inflation
Source: U.S. Bureau of Labor Statistics
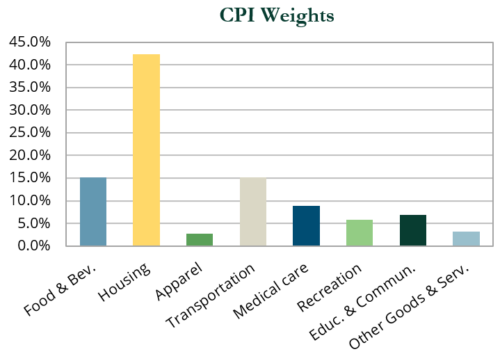
Inflation has the potential to come from a variety of different sources at different time periods, and no inflation measurement is perfect. CPI is one measure of inflation, reflecting changes in prices for personal consumption. Producer Price Index (PPI) is another measure that focuses on changes in producer prices rather than consumer prices. It can be a leading indicator of consumer price changes as producers pass on increases in costs to consumers.
- Energy is a direct subcomponent of the housing and transportation categories in CPI and energy prices permeate throughout virtually all categories.
- Labor prices are an embedded input into all categories of CPI, PPI, and other measures of inflation.
- Housing reflects owners’ equivalent rent and rental housing. Historically, CPI has reflected changes in housing costs on a lagged basis.
- Housing costs are currently rising at a significant clip, indicating housing inflation may be baked into future CPI prints.