September was a difficult month for markets as slowing global growth from a debt overhang in China, ongoing supply chain issues, and persistent inflation sparked fears of stagflation. This comes at a time when many global central banks have reduced or are considering reducing monetary support, notably the tapering of quantitative easing in the U.S. and expected rate hikes in the United Kingdom. Global equity markets bore the brunt of these fears and the S&P 500 experienced its first 5% drawdown in almost a year. Equity losses were not offset by fixed income as bond yields rose, which led to negative returns across the asset class. Inflationary pressures were partly driven by a rally in energy prices, making natural resource equities the lone bright spot during the month.
A liquidity crisis involving one of China’s largest property developers, China Evergrande Group, garnered the attention of global investors and prompted a broad sell-off across Chinese equities. The company’s financial health has long been questioned. However, China’s “three red line” financing policy implemented in August 2020 to reduce excessive leverage across the sector—coupled with a recent collapse in home sales—raised concerns over whether the company would meet an estimated $120 million in debt payments due at the end of the month.
Evergrande’s potential default escalated fear over the health of China’s property sector, which accounts for roughly 25% of GDP, as well as potential contagion across the country’s financial system. Evergrande’s stock price fell over 30% in the days following the announcement and negative sentiment spilled into other segments of the market, particularly those closely tied with the property sector such as financials and materials.
Markets did respond favorably after Evergrande resolved $35.8 billion in onshore obligations and the Chinese government committed to help stabilize the situation to prevent a systemic crisis. However, lingering uncertainty following months of widespread regulatory crackdowns by the Chinese government was enough to drag down the MSCI China Index (−5.0% USD) and the broad MSCI Emerging Markets (EM) Index (−4.0%). China’s big tech and e-commerce names, including Alibaba (−14.0%) and Tencent (−4.2%), also posted sharp declines and were among the largest individual detractors. This underperformance helped value maintain its leadership over growth, as the MSCI EM Value Index (−3.0%) outperformed the MSCI EM Growth Index (−4.9%).
The broad global issues spilled over into developed non-U.S. markets. The MSCI EAFE Index closed the month down 2.9% although the selloff was not as pronounced in the space, particularly in local currency terms (−1.3%) due primarily to strength in Japan (+2.8%). Japanese equities rallied on strong corporate earnings, as well as news that Prime Minister Yoshihide Suga would not seek reelection ahead of the upcoming general election. Suga saw dwindling public support as a result of his handling of the COVID-19 pandemic. His resignation appears to have opened the door for more popular, market-friendly leadership.
The growth vs. value dynamic across developed markets was similar to that of EM countries as the prospect of a shift in monetary policy prompted a global sell-off of growth equities later in the month. For September, the MSCI EAFE Value Index finished ahead of EAFE Growth by approximately 210 bps.

U.S. equity indices lagged their EM and developed non-U.S. counterparts in September. The Russell 3000 Index was down 4.5% in September—the worst monthly return since the early stages of the pandemic. While market losses were broad, value outperformed growth in the U.S. by just over 200 bps (−5.5% Russell 3000 Growth vs. −3.4% for the Russell 3000 Value Index). In reviewing S&P 500 GICS sectors, most sectors were down between 4–7%. Energy (+9.4%) was an extreme outlier as the only sector to post a gain, while financials (−1.8%) was down notably less than the market and remained a key driver for the value index outperformance. Technology (−5.8%) had a tough month following recent strength. Mega caps such as Apple (−7%), Microsoft (−7%) and Amazon (−5%) were not immune to market losses, while Facebook (−11%) and Alphabet/Google (−8%) were down even more. Tesla (+5%) was a notable outlier among mega caps.
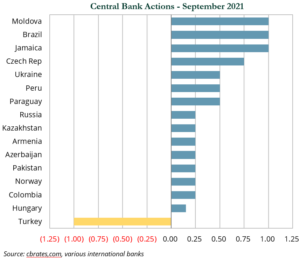
Central banks grew more hawkish on inflation during the month. As shown in the chart to the right, 15 of the 16 central banks that met during the month decided to raise rates. Over the course of the third quarter, 26 central banks raised rates and one (Turkey) cut rates. It is important to note that the majority of the rate hikes occurred in EM and frontier market countries, where inflationary pressures are more sensitive to rising food and energy prices. Perhaps more critical was the hawkish rhetoric from the Bank of England (BoE) and the Federal Reserve. BoE Governor Andrew Bailey surprised markets in late September when he allowed for a potential rate hike as soon as November while the BoE’s bond-buying program remains in place. Fed Chair Jay Powell indicated in the press conference following the conclusion of the Federal Open Market Committee meeting that a taper of its quantitative easing program could begin as soon as November and, more important, could conclude earlier than expected in mid-2022.
With the pullback in equity markets and hawkish central banks, global government bonds and local currency EM sovereign debt fell 1.1% and 1.0%, respectively. When accounting for strength in the U.S. dollar (USD), results in unhedged USD terms were 100 bps worse than in local terms. In the U.S., yields rose and the yield curve steepened. This led to negative returns across the yield curve: 1–3 year (−0.1%), 5–10 year (−1.3%), and 10+ years (−2.9%). With credit spreads being extremely tight at the outset of September and unable to fully absorb yield increases, investment-grade corporates fell 1.1%. The only positive fixed income sectors were bank loans, which gained 0.6%.
 One important factor feeding inflation fears was the sharp rally of energy prices, with the Bloomberg Energy Commodity Sector up 17.0%. Crude prices advanced 9.3% and briefly touched a three-year high at $80 per barrel, while natural gas prices in the U.S. finished at $5.9 MMBtu, a seven-year high. Price increases in Asian and European natural gas markets reached crisis levels with the start of the winter heating season approaching. U.K. natural gas prices ended the month 3.5x higher than they were to start the year, while coal prices, a natural gas substitute, finished more than 3.0x higher. Commodity advances benefited energy equities (+9.4%), which was the only S&P 500 sector to post a positive return.
Higher energy prices continued to be driven by a rapid recovery in global demand resulting from improved Delta variant mitigation efforts, reduced supply, and low production. Supply limitations were largely fueled by actions from the Organization of the Petroleum Exporting Countries (OPEC), which continued to hold back approximately 5.8 million barrels per day despite monthly increases in production quotas.
Meanwhile, U.S. producers have been slow to ramp up production despite higher prices because of their lack of access to capital. This is due in part to investor climate concerns and shareholder demands that companies focus on cash flow distributions instead of production growth.
While these are the primary drivers, numerous other factors exacerbated the price movements, including natural disasters (Hurricane Ida), labor and bottleneck constraints, unusually low wind speeds in Europe, stockpiling of fuel by China, European reliance on Russia for natural gas, steeper carbon prices, low current gas inventories, and forecasts for a colder than usual winter.
While some of these factors will likely fade in the coming months, demand is expected to continue to grow into 2022. To end the month, OPEC forecasted that global crude demand in 2022 will exceed 2019 levels by approximately 1 million barrels per day and the Energy Information Agency forecasted U.S. natural gas demand in the second half of 2021 will exceed 2019 levels.