March brought renewed volatility across global markets as escalating trade tensions and broader geopolitical uncertainty weighed on investor sentiment. U.S. equities declined for the second consecutive month, with the S&P 500 and Russell 3000 indexes falling amid broad risk-off sentiment. Large and mid cap stocks held up better than small caps, while value stocks extended their outperformance overgrowth. Tech-related names, including several members of the Magnificent 7, faced steep losses, contributing to sector-wide weakness in IT, consumer discretionary, and communications.
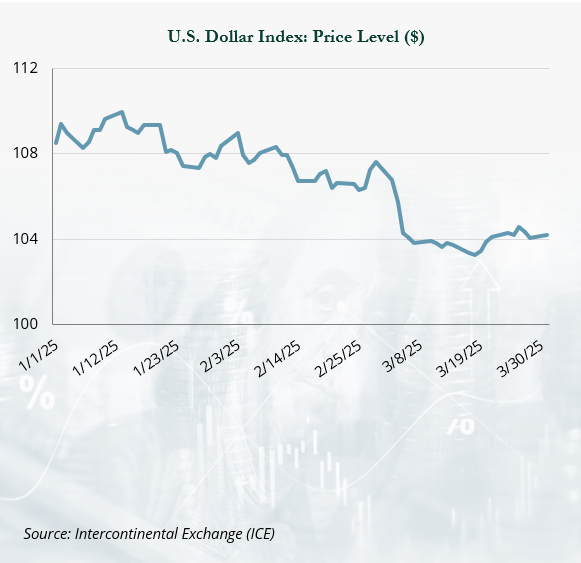
International equities fared better, aided by a weakening U.S. dollar (USD). European and Asian markets experienced late-month pullbacks due to trade concerns, though domestically focused sectors like financials and utilities offered relative strength.
Emerging markets (EM) were mixed—India posted strong gains on policy easing, while Taiwan lagged due to tech sector headwinds.
In fixed income, long-term Treasury yields rose and credit spreads widened, dampening returns across most segments. Short-dated Treasuries and securitized assets provided modest gains.
Real assets outperformed, with strong gains in metals and energy commodities. U.S. REITs declined, though international REITs and infrastructure assets delivered positive returns.
Equities
The domestic equity markets posted their second consecutive down month in March amid tariff fears. The S&P 500 declined 5.6% and the broader Russell 3000
Index lost 5.8% for the month. In a risk-off environment, large and mid caps outpaced small caps, with the Russell 1000 Index down 5.8% versus 6.8% for the Russell 2000 Index.
After trailing sharply in 2024, value stocks notched their third consecutive month of outperformance versus their growth counterparts; the Russell 3000 Value Index declined 2.9% vs. 8.4% for Russell 3000 Growth. Year-to-date through March, value stocks bested growth stocks by over 1,100 bps—their best quarterly showing since 2001.
The Magnificent 7 stocks continued to be under pressure, selling off more than 20% from their late-2024 high. Given their global reach, the Magnificent 7 are particularly vulnerable to trade wars. NVIDIA (−13.2%), Apple (−8.2%), Amazon (−10.4%), and Meta (−13.7%) were the largest individual detractors. Correspondingly, IT (−9.1%), consumer discretionary (−8.9%), and communications services (−8.3%) were the worst-performing sectors. On the other hand, defensive sectors protected investors’ capital in a risk-off environment, with utilities (+0.3%) and consumer staples (−2.3%) outperforming. Energy (+3.3%), a laggard in the prior 12 months, was the best-performing sector in March amid higher oil and gas prices.
Momentum of non-U.S. equities stalled in the final weeks of the first quarter as investors grew increasingly concerned over the size and scope of the looming tariff announcement from the Trump administration. Developed markets fell 2.6% in the last week of March and closed the month down 0.4%. The depreciation of the USD (−3.2%) dampened what was a more severe loss (−2.8%) in local currency terms. The worst performers during the month were found in segments of the market more vulnerable to disruptions in global trade, such as luxury goods (−13.5%), semiconductors (−10.3%), and automobiles (−4.0%). Domestically oriented stocks, such as financials (+2.2%) and utilities (+7.5%), fared better. Energy (+7.2%) companies were also resilient, helped by rising oil and natural gas prices.
Emerging markets followed a similar pattern in the face of global trade uncertainty, falling 3.0% in the final week while ending the month up 0.6%. Taiwan (−11.5%), which traded down in the global tech sell-off, was dragged lower by profitability concerns at semiconductor giant TSMC (−13.2%) after the company announced plans to invest an additional $100 billion over the next four years to build advanced chip manufacturing plants in the United States.
Elsewhere, domestic policy support helped offset trade-related weakness. India (+9.5%) helped lift broad market returns, rebounding after the central bank cut its benchmark rate by 25 bps in response to sluggish growth, alongside additional stimulus measures that further supported sentiment. A recommitment to its 5% GDP growth target in 2025 helped sustain optimism in China (+2.0%).
Fixed Income
While the Fed made no changes to policy rates at its March meeting, the Federal Open Market Committee lowered its growth forecast in the Summary of Economic Projections and raised its inflation outlook. These changes stem from the uncertainty about tariffs. The Fed announced it would begin to slow its balance sheet runoff—a move that, at the margin, is expected to provide slightly more liquidity to the market than would have otherwise been available.
Treasury yields declined modestly across much of the yield curve except for the long end. Two-year Treasuries saw a 9 bps decline in yields while five-year Treasuries saw a 5 bps decline. However, the long-end steepened with a 2 bps increase in the 10-year Treasury and an 11 bps rise in 30-year Treasuries. As a result of these changes, there was little differentiation in returns between Treasury bills (+0.3%), 1-3 year Treasuries (+0.5%), and 5-10 year Treasuries (+0.5%). The rise at the long end of curve led to a 90 bps decline in long Treasuries.
Credit spreads widened during the month, as shown in the chart below. High yield spreads rose 67 bps to 347 bps over comparable Treasuries, while investment-grade corporates and securitized investments saw increases of 5–9 bps. As a result, high yield (−1.0%) lagged investment-grade corporates (−0.3%) and leveraged loans (−0.4%). Securitized outperformed corporates with commercial mortgage-backed securities (MBS) rising 0.3% and asset-backed securities gaining 0.2%. Agency MBS rose a modest 2 bps in March.
Flexible Capital
Hedge funds generally protected capital and outperformed broad markets on a relative basis as the HFRI Fund Weighted Composite Index lost 1.1% in March. Hedge funds had generally begun reducing exposures in late February amidst growing concerns around an economic slowdown, stubborn inflation, and increasing geopolitical uncertainty. The move picked up momentum in March, accelerated by growing uncertainty surrounding the U.S. tariff policy, resulting in a massive deleveraging across the hedge fund industry. Hedge funds net sold global equities at the fastest pace in 12 years, according to both Goldman Sachs and Morgan Stanley prime broker reporting.
Notably, gross exposures came down modestly but it was net exposures that saw the dramatic decline. Most of the selling was driven by long/short equity funds, which focused on both selling longs and growing single-name short positions quickly. This resulted in a decline in global long/short ratios to a five-year low as managers rushed to a more defensive positioning ahead of the expected tariff announcements.
Long/short equity funds lost approximately 2.0%. Losses were largely beta-driven as the equity market sell-off accelerated throughout the month, with crowded exposures in tech, healthcare, and momentum equities driving the largest declines. Fundamental long/short strategies, particularly those with higher net exposures, fared the worst while systematic long/short funds outperformed most hedge fund strategies. Funds that were early to reduce net exposures protected capital as volatility began to rise, and those focused heavily on the short side benefited from the equity sell-off.
Real Assets
Real assets generally outperformed broader markets in March. Gold was up 10.1% as investors flocked to the safe haven asset amidst rising geopolitical uncertainty and concern around looming tariffs from the Trump administration.
The precious metals commodity subindex followed suit, gaining 10.0%. Commodities (+3.9%) fared well in general, with the energy (+4.0%), industrial metals (+4.2%), and livestock (+5.5%) subindices also posting notable gains. Higher metal prices—due in part to recent tariffs and anticipated tariffs on copper—provided an uplift for global metals and mining equities (+4.3%).
Natural gas prices (+5.3%) continued to rise, driven by increased power demand expectations and weather-related factors, alongside the EPA’s announcement of 31 deregulatory actions impacting U.S. environmental policies—including changes to finance and banking requirements within the oil and gas sector.
WTI crude prices rose by 2.5% as global oil exports increased, with OPEC+ set to increase its production in the coming months. North American natural resource equities (+2.8%) benefited from these dynamics. MLPs (+0.0%) were flat for the month.
The midstream energy space continued to offer attractive absolute yields in the 7.3% range due to steady increases in oil and gas production volumes and despite a runup in valuations. With a favorable starting point of the depths of the pandemic (March 2020), the sector delivered an eye-popping 40.1% annual return over the trailing five years.
U.S. REITs (−3.5%) weighed on global REIT performance (−2.3%) as impending tariffs and falling investor sentiment dampened growth expectations for lodging (−10.3%), regional malls (−9.3%), and industrial REITs (−7.5%). Telecom REITs rose 6.7%, driven by increased infrastructure and network spending by mobile carriers. Crown Castle, a major player in the sector, contributed to the gain after selling its underperforming fiber business to sharpen its focus on tower assets.
U.K. and Asia REITs were up 3.9% and 2.3%, respectively, aided by a weaker U.S. dollar. Global infrastructure (+2.1%) and global clean energy (+2.2%) saw modest gains as expectations for power demand continued to rise. ⬛
Indices referenced are unmanaged and cannot be invested in directly. Index returns do not reflect any investment management fees or transaction expenses. Copyright MSCI 2025. Unpublished. All Rights Reserved. This information may only be used for your internal use, may not be reproduced or redisseminated in any form and may not be used to create any financial instruments or products or any indices. This information is provided on an “as is” basis and the user of this information assumes the entire risk of any use it may make or permit to be made of this information. Neither MSCI, any of its affiliates or any other person involved in or related to compiling, computing or creating this information makes any express or implied warranties or representations with respect to such information or the results to be obtained by the use thereof, and MSCI, its affiliates and ech such other person hereby expressly disclaim all warranties (including, without limitation, all warranties of originality, accuracy, completeness, timeliness, non-infringement, merchantability and fitness for a particular purpose) with respect to this information. Without limiting any of the foregoing, in no event shall MSCI, any of its affiliates or any other person involved in or related to compiling, computing or creating this information have any liability for any direct, indirect, special, incidental, punitive, consequential or any other damages (including, without limitation, lost profits) even if notified of, or if it might otherwise have anticipated, the possibility of such damages. Bloomberg Index Services Limited. BLOOMBERG® is a trademark and service mark of Bloomberg Finance L.P. and its affiliates (collectively “Bloomberg”). Bloomberg or Bloomberg’s licensors own all proprietary rights in the Bloomberg Indices. Bloomberg does not approve or endorse this material, or guarantee the accuracy or completeness of any information herein, or make any warranty, express or implied, as to the results to be obtained therefrom and, to the maximum extent allowed by law, it shall not have any liability or responsibility for injury or damages arising in connection therewith. Copyright ©2025, S&P Global Market Intelligence (and its affiliates, as applicable). Reproduction of any information, data or material, including ratings (“Content”) in any form is prohibited except with the prior written permission of the relevant party. Such party, its affiliates and suppliers (“Content Providers”) do not guarantee the accuracy, adequacy, completeness, timeliness or availability of any Content and are not responsible for any errors or omissions (negligent or otherwise), regardless of the cause, or for the results obtained from the use of such Content. In no event shall Content Providers be liable for any damages, costs, expenses, legal fees, or losses (including lost income or lost profit and opportunity costs) in connection with any use of the Content. A reference to a particular investment or security, a rating or any observation concerning an investment that is part of the Content is not a recommendation to buy, sell or hold such investment or security, does not address the suitability of an investment or security and should not be relied on as investment advice. Credit ratings are statements of opinions and are not statements of fact. FTSE International Limited (“FTSE”) © FTSE 2023. FTSE® is a trade mark of the London Stock Exchange Group companies and is used by FTSE under license. All rights in the FTSE indices and / or FTSE ratings vest in FTSE and/or its licensors. Neither FTSE nor its licensors accept any liability for any errors or omissions in the FTSE indices and / or FTSE ratings or underlying data. No further distribution of FTSE Data is permitted without FTSE’s express written consent. Indices referenced are unmanaged and cannot be invested in directly. All commentary contained within is the opinion of Prime Buchholz and is intended for informational purposes only; it does not constitute an offer, nor does it invite anyone to make an offer, to buy or sell securities. The content of this report is current as of the date indicated and is subject to change without notice. It does not take into account the specific investment objectives, financial situations, or needs of individual or institutional investors. Some statements in this report that are not historical facts are forward-looking statements based on current expectations of future events and are subject to risks and uncertainties that could cause actual results to differ materially from those expressed or implied by such statements. Information obtained from third-party sources is believed to be reliable; however, the accuracy of the data is not guaranteed and may not have been independently verified. Performance returns are provided by third-party data sources. Past performance is not an indication of future results. Prime Buchholz LLC© 2025