Overview
The U.S. equity markets delivered strong gains in 2024, with large-cap stocks outperforming small caps, driven by robust corporate earnings and “The Magnificent Seven” mega-cap tech stocks, which contributed nearly half of the S&P 500’s rise. AI dominated the investment landscape, boosting technology and communications sectors. International equities posted modest returns, held back by a strong U.S. dollar and geopolitical tensions, while emerging markets saw wide disparities in performance.
Fixed income experienced mixed results, with front-end Treasuries and credit markets performing well, but long-term Treasuries declined due to a sharp yield curve steepening. Real assets showed varied outcomes, with infrastructure and commodities gaining while REITs underperformed.
Flexible capital strategies gained momentum, particularly in private equity and private credit, with improved deal activity and narrowing valuation gaps. Hedge funds capitalized on AI-driven trends, while distressed credit and event-driven opportunities emerged. These developments reflect growing investor interest in risk assets and strategic capital deployment.
Looking ahead, geopolitical risks, inflationary pressures, and elevated valuations pose challenges.
However, potential rate cuts, improving corporate earnings, and opportunities in undervalued sectors like private real estate and energy transition provide areas of optimism.
U.S. Equities
Investors in U.S. equity markets may feel a sense of déjà vu as 2024 mirrored 2023 in many ways, with strong gains driven by tech and tech-oriented sectors, growth outpacing value, and large caps outperforming small caps.
The S&P 500 advanced 25.0% in 2024, while the broader Russell 3000 Index returned 23.8%. The large- and mid cap-focused Russell 1000 Index gained 24.5%, beating the small cap Russell 2000 Index by roughly 1,300 bps. The Russell 3000 Growth Index gained 32.5% vs. 14.0% for its value counterpart.
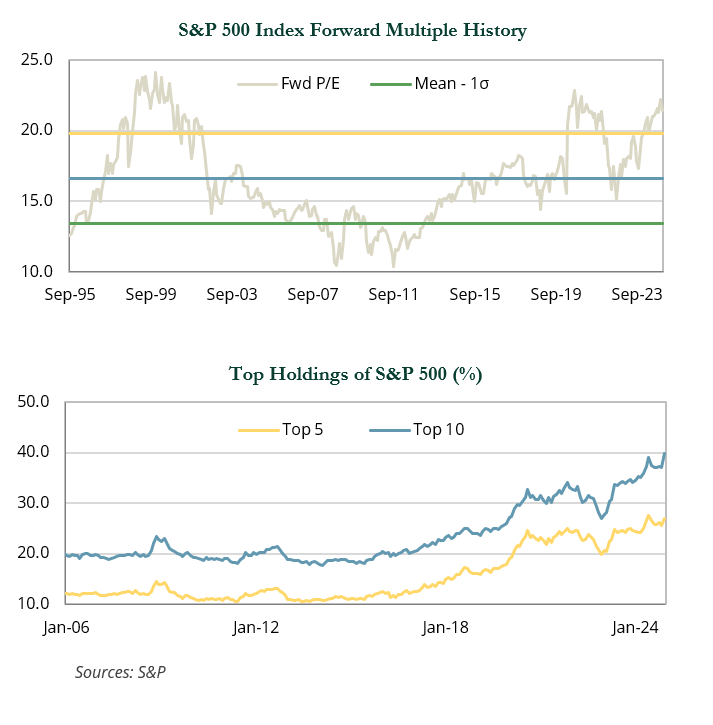
The domestic equity market was buoyed by robust corporate earnings, while the earnings of the S&P 500 constituents were on track to grow 8.7% in 2024 and 14.6% in 2025. However, multiple expansion was the largest driver of calendar-year gains. The S&P 500 started 2024 with a forward earnings multiple of 19.5x and finished at 21.5x. At year-end, the Index was trading more than one standard deviation above its historical average.
AI was the dominant investment theme of the year. Communication services (+39.2%) was the best performing sector, lifted by blue chips Meta (+65.7%) and Alphabet (+35.9%). IT (+35.3%) followed closely behind, with AI pure-play NVIDIA (+170.2%) briefly becoming the world’s most valuable company with a $3+ trillion market capitalization. In all, the “Magnificent Seven” mega cap tech stocks accounted for 48% of the Russell 3000 gains, with NVIDIA making up nearly 20% of the gains by itself.
The continued outperformance of mega cap stocks has resulted in Index concentration not seen over multiple decades. At year-end, the top 10 stocks in the S&P 500 accounted for 39% of the benchmark weight. The top 10 stocks also traded at a significantly higher forward multiple (29.8x) than the rest of the Index (18.2x).
Global Equities
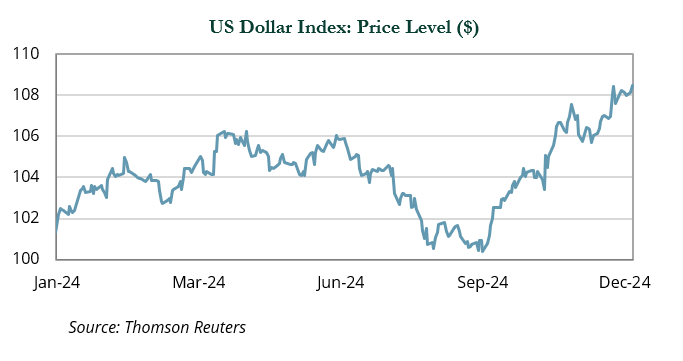
Though modest in comparison to the U.S., developed international (+3.8%) and emerging markets (+7.5%) posted positive returns for the year. During a period of persistent conflict in Ukraine/Russia and the Middle East, as well as ousted political leaders in France and Germany, currency movements had the most significant impact on foreign market returns. The MSCI EAFE and EM Indexes generated double-digit returns in local terms. However, these were eroded by the 7.1% rally of the USD. All this appreciation occurred in the months leading up to, and following, the U.S. election, as the greenback was stoked by the prospects of pro-growth and protectionist policies. Currency impacts aside, the MSCI EAFE’s relative lack of exposure to AI/IT accounted for much of the performance gap with the United States. Japanese equities remained a bright spot, notching a 20.7% gain in local terms, though this came down to 8.3% USD when accounting for yen weakness.
Emerging markets saw wide return dispersion across countries. The AI-theme played a key role in tech-heavy markets such as Taiwan (+34.4%), where Taiwan Semiconductor (+71.5%), the largest individual position in the MSCI EM Index, drove strength.
Elsewhere, many markets were impacted by politics and policy. Investor frustration turned to optimism in China toward year-end and helped push the market up 19.4%. While uncertainty remains elevated—particularly in the face of potential for heightened trade tensions with the U.S.—markets rallied in response to more targeted measures aimed at stimulating consumption and supporting the property market.
Other markets, such as Brazil (−29.8%), Mexico (−27.1%) and South Korea (−23.4%), did not fare as well. Brazil faced setbacks due to fiscal policy concerns, while Mexico struggled with market instability following controversial presidential election results and increased scrutiny from President-elect Trump’s trade rhetoric. South Korea (−23.4%) was dragged down by self-inflicted political turmoil after President Yoon Suk Yeol declared martial law and was subsequently impeached.
Hedge Funds
The common theme across hedge fund performance in 2024 was a consistent bid for risky assets. Growth stocks trumped value, led by technology and anything remotely related to AI, and credit spreads tightened to near-record low levels. Corporate activity remained low overall, limiting the opportunity set for event-driven managers seeking merger-arbitrage and distressed credit investments. However, elevated yields and continued use of liability management exercises (LMEs) allowed many credit managers to generate returns in excess of the high yield index.
The dispersion in equity markets—growth vs. value, large vs. small, AI vs. everything else—led to similarly disparate outcomes across long/short equity managers. Tech-focused managers generally led the way due to exposure to NVIDIA and other mega cap names. High-flying growth names AppLovin and Carvana, which were all but left for dead in the 2022 tech selloff, were some of the strongest performers on the year, returning +700% and +280%, respectively, and exemplify just how potent of a rally we saw in certain areas within tech.
Many non-growth managers were able to capitalize on tangential opportunities within the AI theme via positions in power companies such as Constellation Energy, Vistra, and Talen Energy. Notably, Talen exited bankruptcy in 2023 and was held by many distressed and event-driven managers.
Value-oriented long/short equity managers had a tougher year, most notably over the last two months of the year, after a low-quality rally took hold following the presidential election. Non-profitable companies related to quantum computing and crypto surged, eroding strong short-side alpha generated earlier in the year. However, these types of rallies offer the opportunity to reposition short books. While shorting was difficult in the wake of the post-election equity rally, 2024 looked to be the start of a potentially attractive environment for short-sellers with a backdrop of elevated equity valuations, continued global geopolitical risks, stubborn inflation concerns, and increased dispersion creating more of a stockpickers’ market.
Default rates remained low, particularly within the high yield market. However, the floating-rate leveraged loan market saw defaults surge past 4%. Credit managers have been pursuing LMEs to proactively restructure capital structures of overly indebted companies, but many expect bankruptcies to remain elevated and create additional opportunities. Managers are similarly optimistic that the new administration will usher in a new wave of M&A and corporate activity, which also helps create opportunities for private credit managers lending to private equity-backed companies.
Private Equity
The private equity landscape showed encouraging signs of recovery in 2024, with deal values jumping 36% compared to 2023. By year-end, U.S. private equity deals reached $838.5 billion across 8,473 transactions, while venture capital investments hit $209.0 billion through 13,776 deals showing the market has found its footing after recent adjustments.
Deal activity picked up steam as the valuation gap between buyers and sellers finally started to narrow. Financing conditions improved significantly with both traditional lenders and private credit funds actively competing for deals.
While venture capital activity stayed below the early 2022 peak, AI excitement triggered some eye-popping deals. Several AI companies raised billion-dollar rounds at impressive valuations, though this somewhat skewed the broader market picture. Venture-backed company valuations have largely completed their correction that began in January 2022.
The outlook for 2025 is cautiously optimistic, with several positive factors aligning, as any decline in interest rates would make deals easier to finance and value. Also, the IPO market, which has been quiet for three years, is showing signs of life. According to Foley & Lardner, PE-backed companies are projected to capture 40% of IPO capital raised on major U.S. exchanges in 2025, a significant jump from the decade average.
However, some challenges remain. Exit activity still needs to pick up steam, as PE firms currently hold over 28,000 assets, with 40% held longer than four years. Fund managers are focusing heavily on growing their portfolio companies’ revenue while they wait for better exit conditions.
The secondaries market has become increasingly important, given the low liquidity levels of recent years. Continuation vehicles have helped fund managers provide some investor liquidity while keeping what they consider to be their best assets.
While PE returns have been modest since interest rates started climbing in early 2022, strong company performance and expected rate cuts point to a potential return to strong performance levels in 2025.
Real Assets
REITs underperformed broader markets in 2024, driven by a jump in 10-year bond yields and pared back expectations for federal reserve rate cuts. U.S. REITs gained 7.9% while global REITs moved marginally higher (+0.9%). European and Asian REITs lagged in USD terms (−8.8% and –8.7%, respectively) due to dollar strength, slower economic growth, and concerns over political instability. The cyclical commercial real estate industry may be positioned for further recovery in 2025 due to strong demand across many sectors, including data centers, apartments, industrial, and retail, a sharp reduction in planned new supply, and improved credit availability.
After declining steadily since early 2022, private real estate valuations appeared to be in recovery mode through the third quarter (+0.5%). Historically, many of the best vintages in private real estate have occurred following downturns. In 2024, value-add and opportunistic funds began deploying capital more aggressively, with a focus on acquiring high quality assets where the current owner is saddled with broken balance sheets and in need of liquidity.
Despite higher treasury yields, global infrastructure stocks rallied 15.1% due to strong tailwinds in the midstream energy (+24.4%) and power/utilities (+23.4%) sectors. Midstream energy benefited from increasing U.S. natural gas and oil production and growing global demand. Utilities surged on increasing power demand from data centers facilitating artificial intelligence, and the electrification of industry and manufacturing.
Private infrastructure (+8.6%) continued to attract investor interest given tailwinds across multiple sectors, including the digital infrastructure space, which is less prominent in public infrastructure indices.
Within commodities, gold rallied an impressive 27.5% in 2024 on a combination of factors. These included elevated buying from central banks looking to diversify their reserves away from the USD, a surge in gold ETF inflows as investors anticipated additional rate cuts by central banks, and investors hedging geopolitical risk. Crude oil prices were flat for the year as elevated geopolitical and supply risk around the world was offset by Chinese growth concerns and increasing production. Natural gas prices increased on power-related demand and a stronger outlook for liquified natural gas exports. Overall, energy commodity prices were flat (+1.2%) on the year.
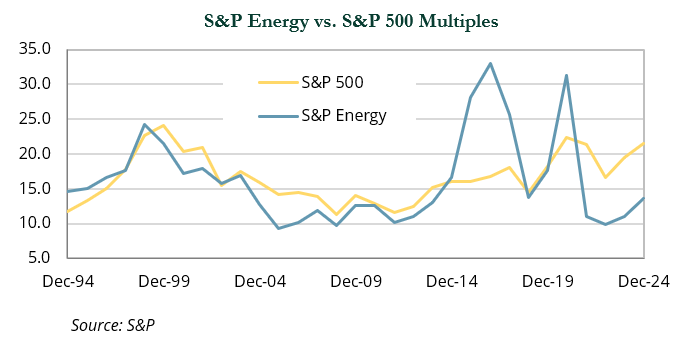
Resource equities (+8.1) remained highly profitable in 2024 and continued to trade at discounted multiples relative to broad equities. Private energy funds (+6.4%) continued to capitalize on strong exit markets as public energy companies looked to replenish depleted inventories via acquisitions of existing assets developed by private equity.
Fixed Income
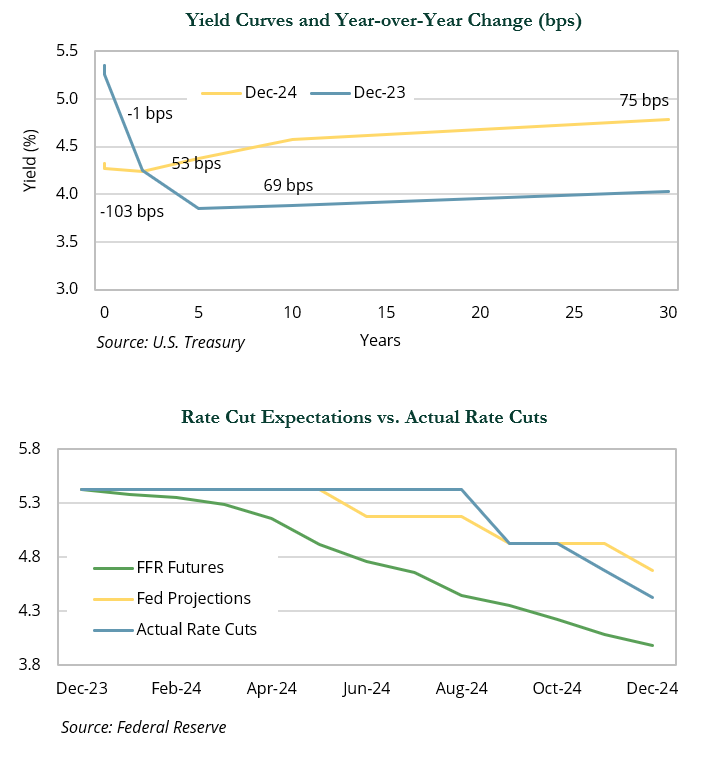
There was a disconnect between the Fed and the market on rate cuts in 2024, which kept interest rate volatility high. The chart to the right compares federal funds rate (FFR) futures prices (as of December 31, 2023) to the Federal Open Market Committee’s Summary of Economic Projections (as of December 13, 2023) to the actual changes in the policy rate through the end of 2024.
Coming into the year, the Fed guided for a reduction of 75 bps in the FFR, while the market priced in between five and six rate cuts.
As inflation proved to be stickier than expected, both the Fed and the market lowered expectations for rate reductions over the course of the year until near the end of the third quarter. The Fed surprised markets with a bigger-than-expected 50 bps rate cut on September 18 and then made two additional 25 bps cuts in November and December, respectively.
These dynamics contributed to a sharp steepening of the yield curve in December. The 2s10s spread widened by 31 bps to close the year at 33 bps, reflecting a 9 bps rise in the 2-year yield and a 40 bps rise in the 10-year yield. Spreads also widened across most sectors during the month, but remained considerably tight for the entire year.
Credit markets outperformed in 2024, with leveraged loans leading the way, returning a robust 8.7%. High-yield bonds trailed not too far behind with a return of 8.2%, while investment-grade corporates posted a more modest gain of 2.1%.
Treasuries showed mixed performance, with 1–3-year Treasuries delivering solid gains of 4.0%, far exceeding the 6.4% decline of long Treasuries. Ultimately, this contributed to lackluster returns for core bonds, with the Bloomberg U.S. Aggregate returning just 1.3% for the year. There were few losers beyond long Treasuries though, as other areas of fixed income mostly delivered positive returns.
Securitized fixed income saw notable gains, led by a 6.6% return in commercial mortgage-backed securities, followed by asset-backed securities, which returned 5.0%, and mortgage-backed securities, at 1.2%.
Indices referenced are unmanaged and cannot be invested in directly. Index returns do not reflect any investment management fees or transaction expenses. Copyright MSCI 2025. Unpublished. All Rights Reserved. This information may only be used for your internal use, may not be reproduced or redisseminated in any form and may not be used to create any financial instruments or products or any indices. This information is provided on an “as is” basis and the user of this information assumes the entire risk of any use it may make or permit to be made of this information. Neither MSCI, any of its affiliates or any other person involved in or related to compiling, computing or creating this information makes any express or implied warranties or representations with respect to such information or the results to be obtained by the use thereof, and MSCI, its affiliates and each such other person hereby expressly disclaim all warranties (including, without limitation, all warranties of originality, accuracy, completeness, timeliness, non-infringement, merchantability and fitness for a particular purpose) with respect to this information. Without limiting any of the foregoing, in no event shall MSCI, any of its affiliates or any other person involved in or related to compiling, computing or creating this information have any liability for any direct, indirect, special, incidental, punitive, consequential or any other damages (including, without limitation, lost profits) even if notified of, or if it might otherwise have anticipated, the possibility of such damages. Bloomberg Index Services Limited. BLOOMBERG® is a trademark and service mark of Bloomberg Finance L.P. and its affiliates (collectively “Bloomberg”). Bloomberg or Bloomberg’s licensors own all proprietary rights in the Bloomberg Indices. Bloomberg does not approve or endorse this material, or guarantee the accuracy or completeness of any information herein, or make any warranty, express or implied, as to the results to be obtained therefrom and, to the maximum extent allowed by law, it shall not have any liability or responsibility for injury or damages arising in connection therewith. Copyright ©2025, S&P Global Market Intelligence (and its affiliates, as applicable). Reproduction of any information, data or material, including ratings (“Content”) in any form is prohibited except with the prior written permission of the relevant party. Such party, its affiliates and suppliers (“Content Providers”) do not guarantee the accuracy, adequacy, completeness, timeliness or availability of any Content and are not responsible for any errors or omissions (negligent or otherwise), regardless of the cause, or for the results obtained from the use of such Content. In no event shall Content Providers be liable for any damages, costs, expenses, legal fees, or losses (including lost income or lost profit and opportunity costs) in connection with any use of the Content. A reference to a particular investment or security, a rating or any observation concerning an investment that is part of the Content is not a recommendation to buy, sell or hold such investment or security, does not address the suitability of an investment or security and should not be relied on as investment advice. Credit ratings are statements of opinions and are not statements of fact. FTSE International Limited (“FTSE”) © FTSE 2025. FTSE® is a trade mark of the London Stock Exchange Group companies and Is used by FTSE under license. All rights in the FTSE indices and / or FTSE ratings vest in FTSE and/or its licensors. Neither FTSE nor its licensors accept any liability for any errors or omissions In the FTSE indices and / or FTSE ratings or underlying data. No further distribution of FTSE Data is permitted without FTSE’s express written consent. Indices referenced are unmanaged and cannot be invested in directly. Index returns do not reflect any investment management fees or transaction expenses. Copyright MSCI 2025. All commentary contained within is the opinion of Prime Buchholz and is intended for informational purposes only; it does not constitute an offer, nor does it invite anyone to make an offer, to buy or sell securities. The content of this report is current as of the date indicated and is subject to change without notice. It does not take into account the specific investment objectives, financial situations, or needs of individual or institutional investors. Some statements in this report that are not historical facts are forward-looking statements based on current expectations of future events and are subject to risks and uncertainties that could cause actual results to differ materially from those expressed or implied by such statements. Information obtained from third-party sources is believed to be reliable; however, the accuracy of the data is not guaranteed and may not have been independently verified. Performance returns are provided by third-party data sources. Past performance is not an indication of future results. © 2025 Prime Buchholz LLC