Commercial real estate (CRE) continues to make headlines due to distressed assets, portfolios, and balance sheets. Underlying stress is concentrated in the office sector, but is being felt in other sectors as well. For example, multi-family deals that were bought at peak prices in 2021-22 and levered up with floating rate debt. Outside of office, distress has largely been driven by broken balance sheets, as opposed to a decline in operations.
Historically, downturns in CRE have created target-rich opportunity sets, producing some of the best vintages in private real estate and most attractive entry points into REITs. However, not all investments made during a downturn will outperform, so it is important to maintain a disciplined approach when navigating this market.
In this investment perspective, we provide an overview of the CRE market and share strategies that may help investors capitalize on opportunities.
Defaults & Maturities
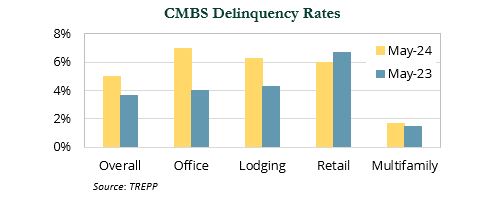
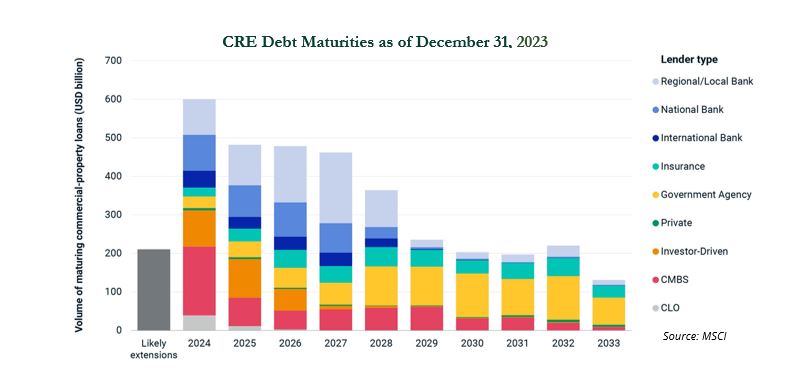
Default rates for commercial mortgage-backed securities (CMBS) increased from 3.6% to 4.9% year-over-year (YoY) as of May 31, 2024—driven primarily by the office sector (6.9%). The all-time high CMBS delinquency rate was 10.3% in July 2012, according to TREPP. Expected loan maturities in 2024 total around $600 billion. Further, MSCI reported $214 billion of loans that were slated to come due in 2023 remain unresolved.
Regional banks have outsized exposure to CRE, particularly the office sector. Many regional banks report they have already allocated adequate reserves or taken losses for office loans that are in trouble or may default.
Fed bank supervisors recently stated that only a “small number of banks have a risk profile that could result in funding pressures.” However, others in the market disagree, with PIMCO recently noting that it expects more regional bank failures in the U.S. because of a “very high” concentration of troubled CRE loans on the books of these banks.
Valuation Shifts
REIT and private real estate valuations have fallen more than 20% from their recent peak. Assets across sectors have all experienced significant value declines from their recent peaks. Lodging, malls, and strip malls have seen the most modest declines, but these sectors previously sold off sharply during the pandemic and never hit valuation highs achieved by other sectors.
These sectors are also less sensitive to interest-rate increases given their already high cap rates. For example, a mall valued at an 8.5% cap rate would decline in value by 13% if cap rates increased by 1.25% (to 9.75%), while a multi-family asset valued at a 4.5% cap rate would decrease in value by 22% if cap rates increased by the same 1.25% (to 5.75%).
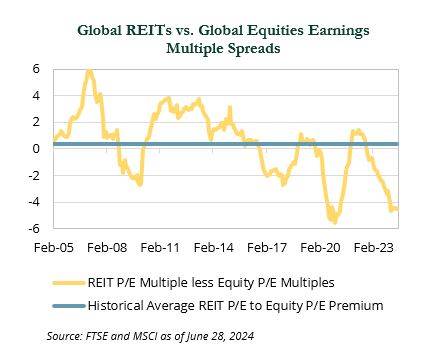
On a relative basis, REIT multiples appeared cheap relative to equities. Historically, REITs have traded at a premium earnings multiple relative to equities, but currently are trading at a discounted earnings multiple relative to equities.
On the other hand, compared to fixed income yields, real estate yields currently look expensive. It is notable that real estate cash flows are expected to grow over time (mid-single digits forecasted for 2024), unlike bond cash flows.
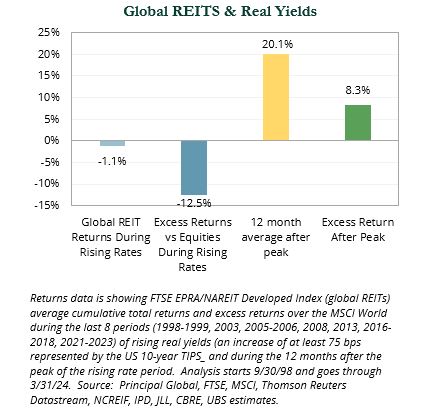
Real Estate & Real Yields
Historically, REITs have underperformed equities during periods of increasing real yields. Conversely, REITs have sharply outperformed equities after real yields have peaked.
Have We Reached the Bottom?
A number of private and public real estate firms believe conditions for CRE have reached their trough. These groups are looking to capitalize on uncertainty caused by headlines and hesitant core investors. Reasons cited include:
- Debt availability is increasing, and the cost of financing (rates + lower spreads) will continue
to fall.
- Fundamentals (supply and demand, occupancies) remain solid across many sectors, with generally moderating rent growth or modest declines in sectors/regions with pockets of oversupply (i.e., sunbelt multifamily), but medium- and long-term tailwinds.
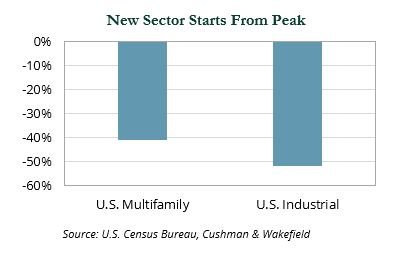
- Minimal new starts or new supply may bode well for fundamentals in late 2025 and 2026.
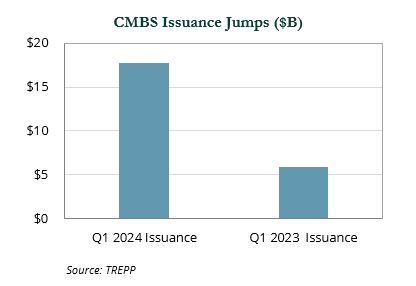
CMBS new issuance was up 170% from the first quarter of 2023 to the first quarter of 2024, and spreads have been tightening. Even high-quality, well-leased office deals have seen increased access to debt. Bank lending is well below historic levels. However, some other lenders—from insurance companies to private debt funds, agencies, and CMBS originators—are seeing value in assets and sectors, which could potentially help drive a recovery in transaction markets.
At the same time, planned new “starts” across sectors have plummeted, setting the stage for attractive demand/supply dynamics in late 2025 and 2026, particularly for sectors with secular tailwinds.
Private equity real estate fund dry powder remained at elevated levels of over $450 billion as of June 2023, according to Pitchbook. While sizable, this value-add and opportunistic capital (not including core focused capital) is relatively small compared to the $22 trillion U.S. CRE market.
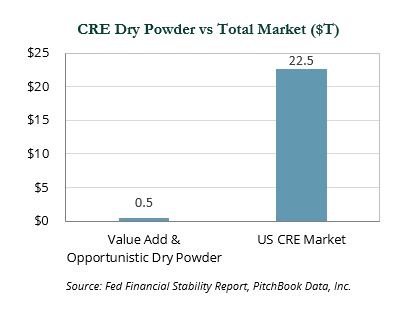
Factors like increased debt availability, stable fundamentals, and minimal new supply suggest a potential bottoming in conditions, but the sizable amount of dry powder reflects still muted transaction volumes in the space.
Opportunity Amidst Rolling Distress
Much like the aftermath of the GFC, distress in the CRE markets is expected to persist for several years, with borrowers and lenders facing ongoing challenges and headlines even after the market hits bottom.
Given the repricing of assets, still-solid fundamentals across many sectors, and a significant decline in planned new supply, the current stage in the cycle may be a particularly attractive period to invest in CRE. This environment creates the potential for target-rich opportunities that allow managers to recapitalize, finance, and invest in growth assets that are saddled with broken or stressed balance sheets at attractive bases.
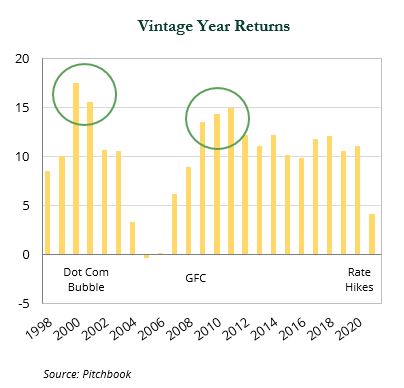
Historically, many of the best times to invest in CRE have occurred during down cycles. As shown below, some of the best vintages in private real estate immediately followed the largest drawdowns in REIT returns.
Investing in downturns can create heightened unease. We believe adhering to longer-term strategic private CRE commitment pacing and target allocations (if implemented via REITs) can mitigate this unease and is the best approach to maximizing returns.
Private Implementation
We recommend investors continue with consistent private CRE commitments to top managers in the space. Rather than focusing on dedicated or “pure” distressed CRE funds, which have produced mixed results historically, we prefer nimble strategies that have investors with deep experience in distressed assets and expertise in operating and creating value in a number of growth sectors (i.e., single family for rent, industrial, data centers, life science, boutique resorts, etc.). These strategies have the flexibility to capitalize on distress via debt and structured opportunities, while also targeting performing assets that can be acquired at discounted bases.
Public Implementation
For investors implementing via REITs, we recommend incremental rebalancing to target allocations, rather than attempting to time the bottom. We recommend targeting strategies benchmarked to diversified REIT indices and provide meaningful exposure to sub-sectors with secular tailwinds.
Please reach out to your client service team with any questions.
Indices referenced are unmanaged and cannot be invested in directly. Index returns do not reflect any investment management fees or transaction expenses. For CA Index data: © 2024 Cambridge Associates. All Rights Reserved. Note: Data is continuously updated and therefore subject to change. For MSCI data: © MSCI 2024. Unpublished. All Rights Reserved. This information may only be used for your internal use, may not be reproduced or redisseminated in any form and may not be used to create any financial instruments or products or any indices. This information is provided on an “as is” basis and the user of this information assumes the entire risk of any use it may make or permit to be made of this information. Neither MSCI, any of its affiliates or any other person involved in or related to compiling, computing or creating this information makes any express or implied warranties or representations with respect to such information or the results to be obtained by the use thereof, and MSCI, its affiliates and each such other person hereby expressly disclaim all warranties (including, without limitation, all warranties of originality, accuracy, completeness, timeliness, non-infringement, merchantability and fitness for a particular purpose) with respect to this information. Without limiting any of the foregoing, in no event shall MSCI, any of its affiliates or any other person involved in or related to compiling, computing or creating this information have any liability for any direct, indirect, special, incidental, punitive, consequential or any other damages (including, without limitation, lost profits) even if notified of, or if it might otherwise have anticipated, the possibility of such damages. Bloomberg Index Services Limited. BLOOMBERG® is a trademark and service mark of Bloomberg Finance L.P. and its affiliates (collectively “Bloomberg”). Bloomberg or Bloomberg’s licensors own all proprietary rights in the Bloomberg Indices. Bloomberg does not approve or endorse this material, or guarantee the accuracy or completeness of any information herein, or make any warranty, express or implied, as to the results to be obtained therefrom and, to the maximum extent allowed by law, it shall not have any liability or responsibility for injury or damages arising in connection therewith. All commentary contained within is the opinion of Prime Buchholz and is intended for informational purposes only; it does not constitute an offer, nor does it invite anyone to make an offer, to buy or sell securities. The content of this report is current as of the date indicated and is subject to change without notice. It does not take into account the specific investment objectives, financial situations, or needs of individual or institutional investors. Information obtained from third-party sources is believed to be reliable; however, the accuracy of the data is not guaranteed and may not have been independently verified. Performance returns are provided by third-party data sources. Past performance is not an indication of future results. © 2024 Prime Buchholz LLC