Education, Market Updates, Perspectives
May 2024 Monthly Market Review
Jun 21, 2024
Back to all posts.Global equity markets experienced a strong rebound in May, particularly in the U.S. and tech sectors. Growth stocks outperformed value stocks, with significant gains in technology, driven by robust performances from NVIDIA and Apple. Declining interest rates benefited both the utilities and real estate sectors, while the energy sector struggled due to falling crude prices.
Internationally, developed markets saw broad-based gains, especially in Europe, boosted by potential interest rate cuts and a weaker U.S. dollar (USD). Japan, however, lagged due to economic concerns despite a stable yen. Emerging markets (EM) showed modest growth, with mixed results in Asia. China performed well in early May due to positive economic policies, but faced challenges by month-end from weak manufacturing data and new tariffs.
Volatility increased in Mexico due to the presidential election, which culminated in the election of Claudia Sheinbaum as the country’s first female president. Across the board, market optimism was driven by positive economic indicators and earnings projections, although geopolitical risks and sector-specific issues persisted.
Global Equities
Following a drawdown in April, equity markets rebounded in May. The S&P 500 gained 5.0%, posting its best May showing in 15 years, while the broader Russell 3000 Index advanced 4.7%. Small caps (+5.0%) narrowly beat large caps (+4.7%), while growth stocks (+6.0%) outpaced their value counterparts (+3.3%).
Tech-oriented sectors posted strong returns. IT (+9.2%) was the best performing sector, with NVIDIA (+26.9%) leading the charge, along with a rebound from Apple (+13.0%). Communications services (+6.6%) was another standout sector, lifted by Meta (+8.5%). A decline in interest rates also boosted the utilities (+8.8%) and real estate (+4.6%) sectors. Energy (+0.2%) was the worst performing sector amid a pullback in crude prices.
With the strong May gains, the forward earnings multiple for the S&P 500 expanded from 19.8x to 20.5x—well above the benchmark’s 10-year average of 17.8x. However, earnings revisions have been trending upwards, with consensus earnings growth projected to come in at 11.1% in 2024 and 14.0% in 2025.
Developed non-U.S. equity markets rose 3.9% in May. Strength was broad based, with every country and sector in the MSCI EAFE Index registering a gain for the month. Japan (+1.3%) failed to keep pace with other foreign markets, despite the yen (+0.1% vs. USD) showing signs of stability, as its economy sputtered. Countries across Europe (+4.8%) enjoyed the strongest returns as investors embraced signs of potential rate cuts at upcoming European Central Bank meetings, though this optimism faded as the month closed. A weaker USD (−1.5%) served as an additional tailwind to non-U.S. markets. From a sector perspective, financials (+7.1%) rallied, led by European banks, insurance, and capital markets companies.
EM equities (+0.6%) were modestly positive during the month. Positive momentum continued in China (+2.4%) before a pull-back at month-end. The International Monetary Fund raised China’s growth forecast from 4.6% to 5.0% for the calendar year on the back of stronger than expected first quarter GDP growth and policy initiatives aimed at the ailing property sector. Markets responded favorably to the package, which included relaxed mortgage rules and a push for local governments to purchase and convert residential properties into public housing. However, shortly after, disappointing manufacturing data reignited concerns related to weak domestic demand and industrial overproduction in certain high-end sectors such as electric vehicles, semiconductors, and renewables. New tariffs imposed on U.S. imports of Chinese goods related to clean energy technologies and critical mineral supplies also contributed to choppiness in the Chinese market during the month.
Elsewhere in Asia, results were mixed but driven by similar themes. Taiwan (+5.3%) was among the top performing major EM countries on continued strength in AI-related semiconductor demand. Conversely, South Korea (−3.6%) was a laggard due primarily to weakness in memory-chip maker Samsung Electronics (−5.3%) which fell on concerns over declining sales and increased competition.
Volatility was heightened in Mexico (−2.5%) ahead of its Presidential election in early June, in which the country elected its first female president, Claudia Scheinbaum. Sheinbaum was largely viewed as a continuation of current President Andrés Manuel López Obrador’s policy. However markets were rattled by the scale of her—and her party’s—victory, which gives her a two-thirds majority and increases uncertainty surrounding potential changes to the constitution and the future business operating environment.
Fixed Income
Two notable factors impacted fixed income markets during May. First, after three straight CPI reports that came in higher than expected, the April CPI report released in mid-May met expectations, which stoked optimism that the disinflationary trend not only stalled during the first quarter of 2024, but was not reaccelerating.
Second, the two-day Federal Open Market Committee meeting concluded on May 1st. While the Fed kept interest rates at current levels, as was expected, the Fed did announce that quantitative tightening would be reduced in June. According to the Fed, the amount of Treasuries on the balance sheet that are allowed to mature will decrease from $60 billion per month to $25 billion per month, meaning more will be reinvested in the markets.
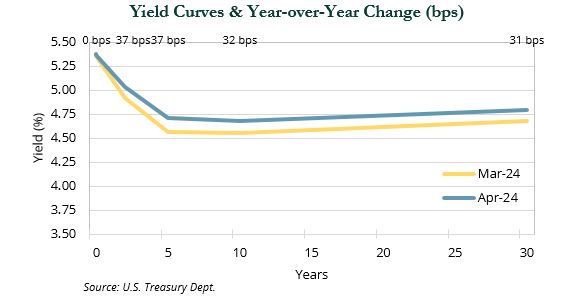
Yields at the 3-month and 6-month points of the curve were largely unchanged, but from the 2-year point to the long end of the curve, yields fell between 16 and 22 bps. While all maturity segments of the Treasury market delivered positive gains in May, the flattening of the curve led to the 2.9% gain in long-term Treasuries outpacing the gains in intermediate-term and short-term Treasuries.
Credit spreads drifted slightly as the change in absolute yields in credit sectors was less than the change in Treasury yields. As a result of a longer-duration profile, agency mortgage-backed securities (MBS) (+2.0%) and investment-grade corporates (+1.9%) outpaced the gains in commercial MBS (+1.5%), high yield corporates (+1.1%), and asset-backed securities (+0.9%).
Real Assets
Real assets were generally positive in May, outside of a recent decline in crude oil prices and related commodities. Public REITs advanced 3.4%, led by cell towers and data centers, which were up 8.3% and 6.1%, respectively. Commercial real estate continues to be in the headlines due to distressed assets and balance sheets. Underlying distress was mostly related to the office sector, but is also present in other sectors such as multi-family, where assets were bought at peak pricing and levered up with floating rate debt.
We expect ongoing distress for borrowers and lenders over the next couple of years, well after “the bottom” in conditions and valuations has been reached.
There are some green shoots for the cyclical sector with new issuance commercial MBS up 170% year-over-year as of March 31st, according to Bloomberg. Lenders are seeing value in assets and sectors, and spreads are tightening. Further, planned “new starts” or new supply has plummeted across key sectors, potentially setting the stage for attractive demand-supply dynamics in 2025 and 2026—particularly for sectors with secular tailwinds.
Commodities overall were up 1.8%, buoyed by the precious metals subindex (+4.6%). Spot Brent Crude prices (−6.0%) fell on near-term factors such as the prospect of reduced voluntary cuts, weaker than expected U.S. gasoline demand, and other economic data that could support a “higher for longer” interest rate policy.
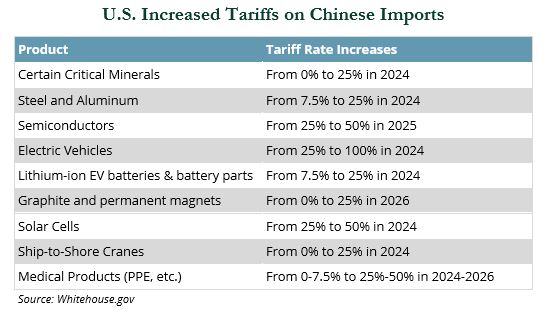
Meanwhile, spot natural gas prices (+54.3%) spiked on warmer than average temperatures during the month, leading to increased usage of air conditioning. AI’s growing demand for low-cost power also contributed to increased natural gas prices. This theme was also a tailwind for clean energy, which rose 12.7%, as the U.S. imposed new tariffs on Chinese exports of certain critical minerals and related clean energy technologies. Several domestic solar stocks have seen recent upswings, with First Solar rising approximately 60% in May.
Despite lower crude prices (−6.0%), natural resource equities rose 2.0% on strong operating fundamentals. Late in the month, ConocoPhillips, the third largest oil producer in the U.S., agreed to acquire Marathon in an all-stock transaction worth $17 billion, continuing the industry’s consolidation trend. ⬛
Indices referenced are unmanaged and cannot be invested in directly. Index returns do not reflect any investment management fees or transaction expenses. Copyright MSCI 2024. Unpublished. All Rights Reserved. This information may only be used for your internal use, may not be reproduced or redisseminated in any form and may not be used to create any financial instruments or products or any indices. This information is provided on an “as is” basis and the user of this information assumes the entire risk of any use it may make or permit to be made of this information. Neither MSCI, any of its affiliates or any other person involved in or related to compiling, computing or creating this information makes any express or implied warranties or representations with respect to such information or the results to be obtained by the use thereof, and MSCI, its affiliates and each such other person hereby expressly disclaim all warranties (including, without limitation, all warranties of originality, accuracy, completeness, timeliness, non-infringement, merchantability and fitness for a particular purpose) with respect to this information. Without limiting any of the foregoing, in no event shall MSCI, any of its affiliates or any other person involved in or related to compiling, computing or creating this information have any liability for any direct, indirect, special, incidental, punitive, consequential or any other damages (including, without limitation, lost profits) even if notified of, or if it might otherwise have anticipated, the possibility of such damages. Bloomberg Index Services Limited. BLOOMBERG® is a trademark and service mark of Bloomberg Finance L.P. and its affiliates (collectively “Bloomberg”). Bloomberg or Bloomberg’s licensors own all proprietary rights in the Bloomberg Indices. Bloomberg does not approve or endorse this material, or guarantee the accuracy or completeness of any information herein, or make any warranty, express or implied, as to the results to be obtained therefrom and, to the maximum extent allowed by law, it shall not have any liability or responsibility for injury or damages arising in connection therewith. Copyright ©2024, S&P Global Market Intelligence (and its affiliates, as applicable). Reproduction of any information, data or material, including ratings (“Content”) in any form is prohibited except with the prior written permission of the relevant party. Such party, its affiliates and suppliers (“Content Providers”) do not guarantee the accuracy, adequacy, completeness, timeliness or availability of any Content and are not responsible for any errors or omissions (negligent or otherwise), regardless of the cause, or for the results obtained from the use of such Content. In no event shall Content Providers be liable for any damages, costs, expenses, legal fees, or losses (including lost income or lost profit and opportunity costs) in connection with any use of the Content. A reference to a particular investment or security, a rating or any observation concerning an investment that is part of the Content is not a recommendation to buy, sell or hold such investment or security, does not address the suitability of an investment or security and should not be relied on as investment advice. Credit ratings are statements of opinions and are not statements of fact. FTSE International Limited (“FTSE”) © FTSE 2023. FTSE® is a trade mark of the London Stock Exchange Group companies and is used by FTSE under license. All rights in the FTSE indices and / or FTSE ratings vest in FTSE and/or its licensors. Neither FTSE nor its licensors accept any liability for any errors or omissions in the FTSE indices and / or FTSE ratings or underlying data. No further distribution of FTSE Data is permitted without FTSE’s express written consent. Indices referenced are unmanaged and cannot be invested in directly. All commentary contained within is the opinion of Prime Buchholz and is intended for informational purposes only; it does not constitute an offer, nor does it invite anyone to make an offer, to buy or sell securities. The content of this report is current as of the date indicated and is subject to change without notice. It does not take into account the specific investment objectives, financial situations, or needs of individual or institutional investors. Some statements in this report that are not historical facts are forward-looking statements based on current expectations of future events and are subject to risks and uncertainties that could cause actual results to differ materially from those expressed or implied by such statements. Information obtained from third-party sources is believed to be reliable; however, the accuracy of the data is not guaranteed and may not have been independently verified. Performance returns are provided by third-party data sources. Past performance is not an indication of future results.