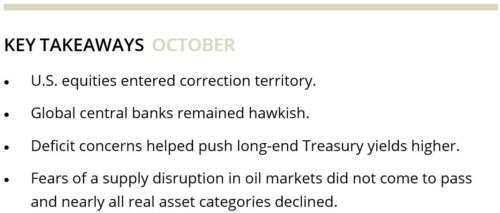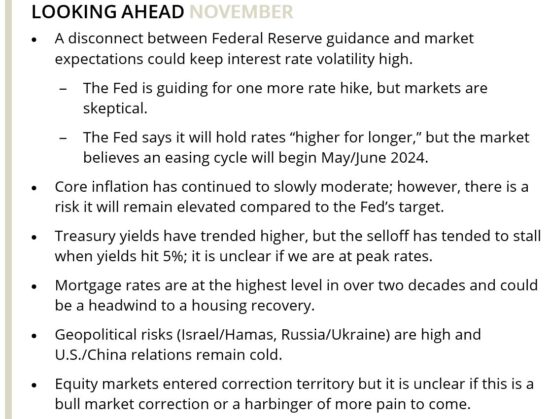
Domestic equity markets experienced a sell-off during October due to concerns about higher interest rates. However, corporate fundamentals remained strong, with many S&P 500 companies beating earnings expectations. Developed non-U.S. equities also declined, particularly in Europe and Japan, but there was optimism about cooling inflation. Emerging markets equities faced headwinds, especially in China, due to concerns about the property sector, economic recovery, and geopolitical risks. In fixed income, Treasury yields rose, and credit spreads widened. Real assets, including oil and natural gas, experienced price fluctuations. The clean energy sector saw poor performance. U.S. REITs declined, and infrastructure was negatively impacted by higher rates.
Equities
Domestic markets sold off for the third consecutive month as higher interest rates stoked fears of a hard economic landing. The S&P 500 fell 2.1% for the month; by late October, it had entered correction territory. Small cap stocks, as measured by the Russell 2000 Index, posted an even larger decline than their mid-cap and large-cap counterparts, falling 6.8% for the month. The October equity market drawdown was broad-based as utilities (+0.8%)—one of the more defensive sectors—was the only sector to finish the month in positive territory.
Despite weak investor sentiment, corporate fundamentals continued to improve. Over 80% of the S&P 500 constituents with reported earnings beat consensus expectations, putting the Index on track to generate positive year-over-year earnings growth. At the month-end, the S&P 500 traded at a 17.3x forward multiple, slightly below its 10-year average of 17.5x.
Developed non-U.S. equities declined 4.1%, with weakness widespread across regions. In Europe (−3.7%), the Eurozone economy remained stagnant with further weakness in business and manufacturing activity during the month. However, there was optimism around cooling inflation, which hit a two-year low. Japan (−4.5%) improved toward the end of the month after the Bank of Japan (BOJ) said it would allow more flexibility in its yield curve control policy. The yen (−1.5%) remained weak relative to the USD, which factored into the BOJ’s decision. Currency movements on the whole were a headwind as the MSCI EAFE Index was roughly 70 bps higher in local terms.
Emerging markets equities fell 3.9% (USD). Headwinds persisted in China (−4.3%), where the CSI 300 Index, a measure of the top 300 stocks listed on the Shanghai and Shenzhen Stock Exchanges, hit a pre-pandemic low after falling nearly 40% from its 2021 peak. Reports showing better-than-expected growth in the third quarter were released in late October but the upside surprise in growth was not enough to stall the equity market sell-off as investors remain focused on turmoil in the property sector, a fragile economic recovery, and heightened geopolitical risks.
Elsewhere, India (−2.9%) reversed course from the previous month. Mixed earnings results combined with rising oil prices and tight global financial conditions caused heightened uncertainty surrounding the sustainability of the country’s economic growth momentum. India imports approximately 80% of its oil, which means it is vulnerable to the impact of Middle East tension on energy prices.
Fixed Income
Financing the deficit continued to be in the forefront of investors’ minds. Treasury yields from the three-month to the two-year points on the curve trickled higher by a few basis points, but the long-end of the curve saw more dramatic moves with the 10-year rising 33 bps to 4.9% and the 30-year rising 36 bps to 5.1%. The 10-year Treasury briefly pierced 5% in October, but experienced a late-month rally as the Treasury Department released issuance plans for the next quarter that were lower than markets expected. However, the damage was already done and both the intermediate-term (−1.4%) and long-end of the curve (−4.9%) lagged T-bills and front-end Treasuries.
Credit spreads widened with high yield rising 43 bps to 437 bps and investment-grade corporates increasing 8 bps to 129 bps. Securitized assets also increased with MBS, CMBS, and ABS rising 9, 10, and 11 bps, respectively. Rising yields and wider spreads led to negative performance across spread sectors, with investment-grade corporates, high yield corporates, and securitized assets dropping between 1.2% and 2.0%.
Real Assets
Real assets were down for the third straight month. U.S. REITs declined 4.5% as Treasuries hit new highs. Headlines about stressed/distressed assets were pervasive amid a difficult financing environment, with U.S. office REITs falling 9.8%. October’s declines brought YTD returns in the office sector to −25.5%. Data center REITs, the top performing REIT sector YTD (+17.9%), was one of the few REIT sectors to see positive returns (+1.3%). Global REITs fell 4.8%. Infrastructure (−3.0%) was also negatively impacted by higher rates.
After a strong rally in the third quarter, the price of Brent crude fell 7.8%. Prices initially spiked following the start of the Israel-Hamas war due to generalized uncertainty in the Middle East. However, prices cooled in the following days as there was no immediate disruption to supply. Iran has sidestepped recent U.S. and European sanctions, bringing oil supply to the global market, which helped moderate prices. If these sanctions are more strictly enforced, the global oil supply should decline and prices could rise.
Resource equities (−4.0%) were down on the dip in oil prices. Natural gas prices surged 33.5%, most of which occurred in the final week of the month as forecasts called for a slightly colder winter than initially expected. While natural gas is up 1.6% YTD, it is down 28.7% year-over-year after an extended period of elevated prices following Russia’s invasion of Ukraine. Two of the oil industry’s largest companies made blockbuster acquisitions during the month, with Exxon acquiring Pioneer Natural Resources for $60 billion, and Chevron acquiring Hess for $53 billion. These moves represent a larger consolidation theme within the oil industry. For most of 2023, oil companies have exercised discipline, focusing more on returns and capital efficiency and less on production, which led to a supply decline. To replenish supplies, the companies looked at Western acquisition targets due to perceived risks overseas. Exxon and Chevron have resources to enhance their recently acquired drilling infrastructure, allowing for greater overall extraction from existing wells in a maturing industry.
Clean energy fell 11.3%, bringing losses to 29.0% over the trailing three-month period and 34.3% YTD. Clean energy valuations are now in line with July 2020 prices—before the industry saw the bulk of its 141.3% gain in 2020. Factors impacting valuations include increased financing costs, which diminish the value of future cash flows. A stream of poor earnings reports have also weakened investor sentiment after the highs of President Biden’s election and the Inflation Reduction Act announcements. Many investors now appear to be more focused on AI and infrastructure plays. A number of offshore wind projects off New York, Britain, the Netherlands and Norway have been shelved due to financing costs. Additionally, many solar companies are tied to the semiconductor industry and supply chains have been impacted by geopolitical tensions and uncertainty over the future of Taiwan.

Indices referenced are unmanaged and cannot be invested in directly. Index returns do not reflect any investment management fees or transaction expenses. Copyright MSCI 2023. Unpublished. All Rights Reserved. This information may only be used for your internal use, may not be reproduced or redisseminated in any form and may not be used to create any financial instruments or products or any indices. This information is provided on an “as is” basis and the user of this information assumes the entire risk of any use it may make or permit to be made of this information. Neither MSCI, any of its affiliates or any other person involved in or related to compiling, computing or creating this information makes any express or implied warranties or representations with respect to such information or the results to be obtained by the use thereof, and MSCI, its affiliates and each such other person hereby expressly disclaim all warranties (including, without limitation, all warranties of originality, accuracy, completeness, timeliness, non-infringement, merchantability and fitness for a particular purpose) with respect to this information. Without limiting any of the foregoing, in no event shall MSCI, any of its affiliates or any other person involved in or related to compiling, computing or creating this information have any liability for any direct, indirect, special, incidental, punitive, consequential or any other damages (including, without limitation, lost profits) even if notified of, or if it might otherwise have anticipated, the possibility of such damages. Bloomberg Index Services Limited. BLOOMBERG® is a trademark and service mark of Bloomberg Finance L.P. and its affiliates (collectively “Bloomberg”). Bloomberg or Bloomberg’s licensors own all proprietary rights in the Bloomberg Indices. Bloomberg does not approve or endorse this material, or guarantee the accuracy or completeness of any information herein, or make any warranty, express or implied, as to the results to be obtained therefrom and, to the maximum extent allowed by law, it shall not have any liability or responsibility for injury or damages arising in connection therewith. Copyright ©2023, S&P Global Market Intelligence (and its affiliates, as applicable). Reproduction of any information, data or material, including ratings (“Content”) in any form is prohibited except with the prior written permission of the relevant party. Such party, its affiliates and suppliers (“Content Providers”) do not guarantee the accuracy, adequacy, completeness, timeliness or availability of any Content and are not responsible for any errors or omissions (negligent or otherwise), regardless of the cause, or for the results obtained from the use of such Content. In no event shall Content Providers be liable for any damages, costs, expenses, legal fees, or losses (including lost income or lost profit and opportunity costs) in connection with any use of the Content. A reference to a particular investment or security, a rating or any observation concerning an investment that is part of the Content is not a recommendation to buy, sell or hold such investment or security, does not address the suitability of an investment or security and should not be relied on as investment advice. Credit ratings are statements of opinions and are not statements of fact. FTSE International Limited (“FTSE”) © FTSE 2023. FTSE® is a trade mark of the London Stock Exchange Group companies and Is used by FTSE under license. All rights in the FTSE indices and / or FTSE ratings vest in FTSE and/or its licensors. Neither FTSE nor its licensors accept any liability for any errors or omissions In the FTSE indices and / or FTSE ratings or underlying data. No further distribution of FTSE Data is permitted without FTSE’s express written consent. Indices referenced are unmanaged and cannot be invested in directly. Index returns do not All commentary contained within is the opinion of Prime Buchholz and is intended for informational purposes only; it does not constitute an offer, nor does it invite anyone to make an offer, to buy or sell securities. The content of this report is current as of the date indicated and is subject to change without notice. It does not take into account the specific investment objectives, financial situations, or needs of individual or institutional investors. Some statements in this report that are not historical facts are forward-looking statements based on current expectations of future events and are subject to risks and uncertainties that could cause actual results to differ materially from those expressed or implied by such statements. Information obtained from third-party sources is believed to be reliable; however, the accuracy of the data is not guaranteed and may not have been independently verified. Performance returns are provided by third-party data sources. Past performance is not an indication of future results.