Risk assets delivered positive returns in July. U.S. equities rose 3.6%, while non-U.S. developed and emerging markets (EM) equities gained 3.2% and 6.2%, respectively. The price of oil rose and other commodities—from agriculture to industrial metals—also rallied, which helped drive real asset categories higher.
With inflationary pressures easing and investors believing global central banks are at or near the end of their tightening cycles, the “soft landing” narrative gained steam during the month. Yields at the long end of the curve did rise, lending credence to the soft landing thesis, but the yield curve remains deeply inverted. As a result, intermediate and long-term Treasuries declined in July while credit investments—investment grade, leveraged loans, high yield bonds, and EM debt—rose along with other risk assets.
Domestic equity markets posted their fifth consecutive month of gains in July. The S&P 500 advanced 3.2%, while the broader Russell 3000 Index returned 3.6%. Moderating inflationary pressures, solid GDP growth, and better than expected corporate earnings all contributed to the investor optimism.
Energy (+8.1%) was the best performing sector, propelled by higher oil and natural gas prices. Communications services (+6.9%) followed closely behind, lifted by strong earnings from blue chips Alphabet (+10.9%) and Meta (+11.0%). Financials (+5.9%) also outperformed due to a rebound among banks (+11.6%). Conversely, healthcare (+0.9%)—a less economically sensitive sector—lagged, as did defensive utilities (+2.4%), consumer staples (+2.2%), and real estate (+2.1%).
In a risk-on market environment, small caps outpaced their large cap counterparts; the Russell 2000 Index gained 6.1% versus 3.4% for the Russell 1000 Index. Value (+3.7%) and growth (+3.4%) stocks performed close in line with one another, as measured by the Russell 3000 style indices. Year-to-date, large caps continued to lead small caps (+20.7% vs. +14.7%) and growth stocks were well ahead of value stocks (+32.5% vs. +8.9%).
Developed non-U.S., as measured by the MSCI EAFE Index, posted another monthly gain (+3.2%) despite ongoing concerns over slowing economic growth abroad. Business activity fell in both the euro area (+2.4%) and United Kingdom (+3.4%); however, there was optimism as inflation in these areas moderated in July. Investors were also encouraged by the euro area’s return to growth in the second quarter.
Currency movements remained a tailwind, bolstering a more modest local currency return for the MSCI EAFE Index (+1.7%). The euro and British pound gained on the U.S. dollar (USD) again in July. The yen (+1.7%) reversed course from losses earlier in the year and bolstered equity returns for U.S.-based investors. This was a double-edged sword, as the weaker yen also helped drive positive performance of many of Japan’s large, export-oriented companies.
EM equities (+6.2%) benefited from a rally in China (+10.8%), where markets reacted to the prospect of thawing relations with the U.S. and another round of stimulus measures. A meeting between U.S. Treasury Secretary Janet Yellen and Chinese economic policy makers helped temper sentiment after Yellen used a softer tone than was used during the previously contentious de-coupling discussions. Markets also responded favorably to minutes from the Chinese Communist Party Politburo meeting, where leadership reaffirmed its pledge to support the post-COVID economy.
Details regarding the Chinese stimulus were limited, but it fell short of massive fiscal and monetary policy loosening in favor of what were described as prudent and proactive measures. Key takeaways include proposals to boost household consumption, stabilize employment, resolve local government debt issues, and ease property market regulations. The news helped boost the MSCI China Index 7.4% in the final week of the month. Chinese stocks levered to consumption and real estate were notable beneficiaries
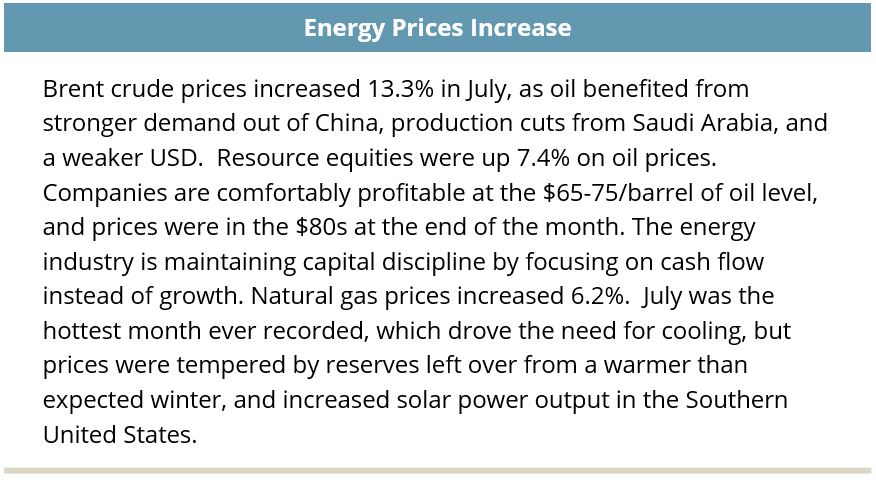
Improved sentiment in China proved to be a tailwind for commodities, which gained 6.3%, led by energy (+11.9%) and industrial metals (+6.9%). Broadly, real assets posted solid gains in July. Global real estate increased 3.8% on an improved economic outlook and amidst expectations that the rate cycle may be coming to an end. Europe (+10.4%) and the U.K. (+8.6%) delivered strong performance in the month, but still lagged the broader index over the trailing one-year period.

U.S. office defaults rose during the month, while office REITs (+13.3%) rallied due to improved leasing activity across multiple markets, notably in the Southeast and the Bay Area. Retail (+4.5%) and data centers (+5.2%) also contributed to index performance, while infrastructure REITs were down 3.2%, making it the index’s worst performing sector YTD (−13.5%) and over the trailing one-year period (−31.8%). Infrastructure REITs are primarily comprised of cell towers leased to wireless carriers. The high growth cell tower sector has been negatively impacted by higher interest rates in the last 12 months, and most recently carriers have been reeling from headlines alleging that long abandoned phone lines by AT&T and Verizon are contaminating the local land and water with lead, which would require capital-intensive remediation.
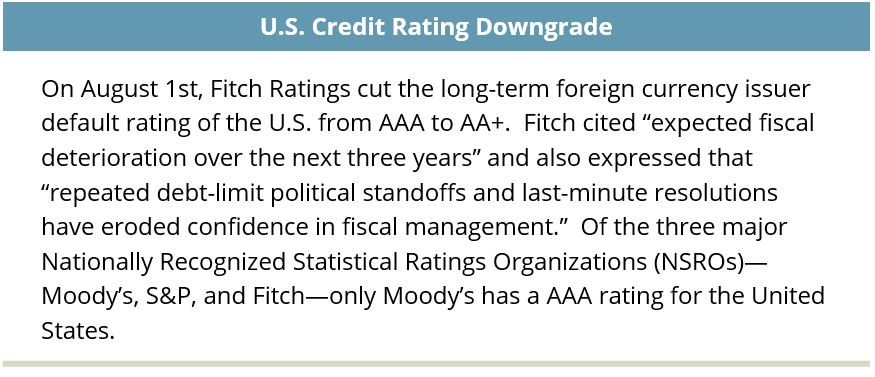
The Fed raised rates by 25 bps to a range of 5.25–5.50% in July. Although guidance from its June meeting and ongoing rhetoric in various Fed speeches suggest one more rate hike in 2023, markets are somewhat skeptical and many believe that the tightening cycle is over. During the pause between the end of the tightening cycle and the start of an easing cycle, yield curves normally steepen; this happened in July with the yield on 10-year and 30-year Treasuries rising 14 bps and 17 bps, respectively, to 3.95% and 4.02%. The yield on the 2-year Treasury fell 1 bps, to 4.86%, while on the 5-year Treasury it rose 6 bps, to 4.19%.
The moves in yields caused the spread between two-year and 10-year Treasuries (the “2s10s” spread) to rise from −106 bps to −90 bps and the 5s30s spread to rise from −28 bps to −17 bps. Lastly, with an 11 basis point increase in the 3-month T-bill to 5.42%, a result of the Fed rate hike, the spread between it and the 10 year rose from −150 bps to −147 bps. Thus, the yield curve continues to be deeply inverted, which calls into question the soft landing narrative.

In this environment, T-bills and Treasuries in the 1-3 year maturity range rose 0.4% and 0.3%, respectively, and outperformed the −0.3% and −2.2% return of intermediate-term and long-term Treasuries, respectively. Spread sectors traded higher, with gains in high yield (+1.4%), leveraged loans (+1.0%) and investment-grade corporates (+0.3%). Within the securitized space, commercial mortgage-backed securities (+0.2%) and asset-backed securities (+0.4%) each outperformed agency-backed residential mortgages (-0.1%).