Investor exuberance did not carry over from January to February, as markets were met with a dose of reality related to central bank policy and geopolitical risks. A strong January labor report and reaccelerated inflation caused markets to reassess the path of interest rates. Despite Fed rhetoric to the contrary, traders expected an easing cycle in 2023; however, this changed meaningfully following the release of economic reports during February.
Rising interest rates and a mediocre outlook for earnings led to low single-digit declines in global developed market equities in U.S. dollar terms. Developed non-U.S. was mildly positive in local currency terms although returns turn modestly negative when the impact of the strong U.S. dollar (USD) is factored. Rising interest rates led to weak returns across bond markets in February. Meanwhile, inflation-hedging assets with sensitivity to interest rates (e.g., real estate) and pro-cyclical sectors (e.g., energy and industrial metals) also declined.
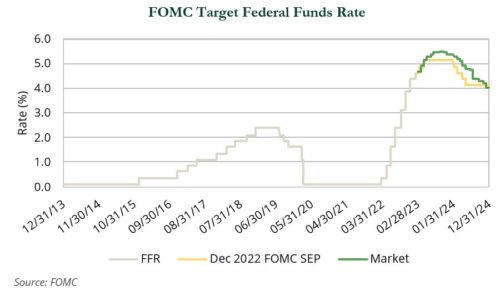
Prior to February, markets were skeptical of the Federal Open Market Committee’s (FOMC) December 2022 forecast of a 5.1% federal funds rate. Instead, markets believed the terminal rate would not pierce 5% and that the Fed would begin an easing cycle sometime in the second half of the year. Traders repriced the path of policy rates after the non-farm payroll report came in stronger than expected earlier in the month and CPI reaccelerated in the middle of the month. The market now expects the FOMC to raise its terminal federal funds rate guidance from 5.1% to 5.4% at the March meeting and for the easing cycle to not begin until early 2024.

A lackluster earnings season and the threat of even higher interest rates led to an equity market pull back in February. The S&P 500 and the broader Russell 3000 Index declined 2.4% and 2.3%, respectively, with broad-based weakness across market capitalizations, styles, and sectors. Small caps narrowly outperformed large caps, but both indices declined approximately 2.0%. Growth stocks held up marginally better than value, with the Russell 3000 Value Index down 3.5% versus 1.2% for the Russell 3000 Growth Index.
The growth index was buoyed by IT (+0.5%), which was the only GICS sector to finish the month in positive territory. Strong earnings from NVIDIA (+18.8%) and a small gain from defensive bellwether Apple (+2.3%) lifted the performance for the sector. Energy (−6.5%) posted the largest drawdown followed closely by real estate (−5.9%) and utilities (−5.7%). Real estate and utilities, which are defensive sectors and are treated as bond proxies by investors, sold off as interest rates rose.
Developed non-U.S. equities, as measured by the MSCI EAFE Index, closed the month in positive territory in local currency terms. However, a resurgent USD (+2.7%) served as a headwind for U.S. investors and the index fell 2.1% in USD terms. The yen (−4.5%), pound (−1.7%), and euro (−2.4%) all lost ground to the greenback as the latter rallied on expectations of a more hawkish Fed. The U.K. (+1.9% local, +0.2% USD) was particularly resilient during the month on signs of economic improvement, including: (i) the highest level of consumer confidence in a year, (ii) rising business activity following a six-month decline, and (iii) Prime Minster Rishi Sunak reaching a deal with the European Union that could put Brexit to rest.
In contrast to its developed market counterparts, the 6.5% decline in emerging markets (EM) equities was a reminder that geopolitics and idiosyncratic, country-specific events can weigh heavily on returns. In China, the positive sentiment that followed continued reopening progress in January reversed course in February, as equity markets fell 10.4% as risk aversion increased following several negative headlines. The most prominent of these was the fallout stemming from the Chinese surveillance balloon that crossed into U.S. airspace before being shot down by the U.S. military. The incident strained an already a fragile relationship between the U.S. and China as Secretary of State Anthony Blinken cancelled his planned meeting with Chinese President Xi Jinping, which would have marked the first visit from a U.S. Secretary of State in more than five years.
Markets in India (−4.6%) also fell victim to a shift in sentiment which pressured the broad EM asset class. While some of India’s pullback was attributable to profit-taking and investors rotating capital into China, a scandal at one of the country’s most prominent industrial conglomerates, Adani Group, rattled markets. The company’s 10 publicly traded subsidiaries lost an estimated $102 billion in market cap and cancelled a $2.4 billion equity raise after a short-seller report accused the group of accounting fraud and stock price manipulation after the group of stock appreciated 3,000% in three years. While the group of stocks represent less than 1% of the MSCI EM Index combined, negative sentiment was a drag on overall equity market performance. State-owned banks were hit particularly hard on uncertainty surrounding Adani-related loan exposure.
The repricing of Fed policy after the labor and inflation report led to weakness in the Treasury market in February, reversing a large portion of the gains achieved during the January market rally. Yields rose across the curve, but the biggest changes occurred in the two-year (+59 bps) and in the five-year (+53 bps) parts of the curve. By comparison, the 10-year increased 39 bps and the 30-year rose 27 bps. As a result of these changes, the yield curve inversion between the two- and 10-year Treasuries—known as the “2s10s spread”—fell to its lowest point since the 1980s. Despite larger increases in the belly of the curve, the impact of duration caused long-term bonds to underperform their short-intermediate term counterparts.
Corporate credit spreads were mixed. Investment-grade bonds widened by 7 bps to 124 bps as a result of heavy new issuance activity. Companies tapped debt markets at a faster pace in February ahead of additional rate hikes. High yield corporates saw spreads tighten by 8 bps to 412 bps. As a result of being shorter in duration and from having a larger spread cushion, high yield corporates – while still down for the month – held up better than investment-grade corporates.
Although still negative, asset-backed securities was one of the better performing subsectors with spread tightening by 8 bps due in part to lower issuance providing a technical tailwind. Mortgage-backed securities (MBS) markets saw spreads widen by 5 bps as rate volatility has continued to impact the mortgage market. Wider credit spreads led to negative returns across spread sectors.
Interest-rate sensitive areas of the real assets sectors declined in February. REITs (−4.4%) gave back some of January’s strong gains, but remained up 4.3% year-to-date. Results in 2023 have been strongest within subsectors that have secular tailwinds, including industrial, multi-family, and self-storage. In contrast, office and retail have lagged. The office sector faces significant uncertainty given the apparent permanence of hybrid work arrangements in the U.S. Office commercial MBS loan default rates have inched higher in recent periods (1.9% as of January 2023). With significant debt maturities scheduled for 2023 and beyond, defaults have the potential to increase further.
Elsewhere in real assets, overall commodity prices were down 4.7%,led by declines in industrial metals (-9.1%) and energy (-3.3%). The fall in energy prices and pessimism on the earnings outlook led to a 7.3% drop in resource equities. Energy prices fell due to growing sentiment that China’s reopening from its zero-COVID policy may not boost demand for crude and a broad range of commodities as expected. A stronger dollar, which makes commodities more expensive for foreign currency holders, was also a headwind for commodities.
Infrastructure equities fell 3.4% as declines in utilities and transportation offset modest gains from midstream energy stocks, which continued to benefit from higher volumes and robust earnings.
