Capital markets rallied in November, with gains achieved across both risk-free and risk assets. Interest rates were volatile during the month, but the bond market reacted favorably to a weaker-than-expected CPI report released November 10th and to Fed Chair Jerome Powell’s perceived dovish comments on November 30th. In fact, those two factors contributed to a large portion of the gains in U.S. equity markets in the month. Outside of the U.S., China’s plan to relax its zero-COVID policy and reopen its economy reverberated positively in non-U.S. developed and emerging market equities. Within real assets, REITs were the standout performer, rallying with the drop in interest rates.
Following the Fed’s fourth straight 75 bps hike, investors were looking for clues about a potential slowing in the pace of rate hikes during this tightening cycle. The Fed had been telegraphing a slowdown in the pace of rate hikes for several months, but Powell’s November 30th speech confirmed that the Fed is likely to slow the pace beginning in December. However, there is a risk that markets may be misinterpreting how policy could develop in 2023.
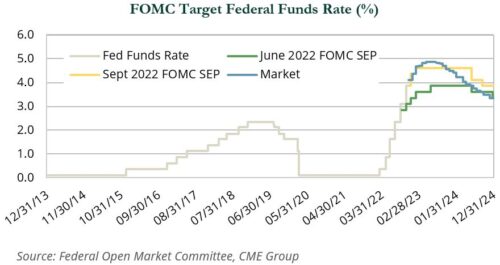
The graph below shows the path of interest rates based on the Federal Open Market Committee’s (FOMC) most recent Summary of Economic Projections compared to federal funds rate (“FFR”) futures pricing on November 30. Markets were pricing a terminal FFR of just under 5%, which aligns with recent comments made by Powell. However, markets appear to believe that after reaching the terminal rate, a sharp easing cycle will begin in the latter half of 2023 vs FOMC guidance for a hold after the FFR reaches its terminal level. Although Fed projections could change, the data shows a disconnect between the Fed and markets.
Despite this disconnect, fixed income markets rallied over the month. The yield curve inversion between two- and 10-year Treasuries widened and the spread between the 3-month and 10-year Treasury bills also inverted. Yields at the long-end fell, as the threat of a business cycle shift increased, while yields at the front end were influenced by Fed policy. As a result of these shifts, intermediate Treasuries gained 3.1% while long-term Treasuries rallied 7.1%.
Credit sectors also performed well. Investment-grade corporate credit spreads tightened 25 bps, with BBB-rated credit tightening the most, at 27 bps. High-yield credit experienced spread tightening, although it was less pronounced at 16 bps. Investment-grade corporates, which are more rate-sensitive, rose 5.2%, and high yield rose 2.2%.
Domestic equity markets posted a second consecutive month of strong performance. The S&P 500 Index returned 5.6%, and the broader Russell 3000 Index advanced 5.2%. Expectations of lower inflation and rates drove the markets higher in November. The largest single-day gain for the S&P 500 came on November 10th (+5.5%) following a softer-than-expected inflation report; the Index also rallied 3.1% on the last day of the month, after Powell reiterated that the Fed may slow its tightening pace.
As shown in the chart on the next page, since 1970, there have been 14 instances when the S&P 500 posted two consecutive months with gains over 5%. Subsequent performance following these periods has generally been strong, with the Index generating average gains of 21% in the following 12 months. The consistency of the strong performance also stood out; the Index posted 12-month gains in 13 of the 14 instances.
Value stocks continued to outperform growth stocks in November, as the Russell 3000 Value Index returned 6.1%, versus 4.4% in the Russell 3000 Growth Index. Year-to-date, value extended its leadership over growth to over 1,900 bps. In a reversal from October, large caps outpaced their small cap counterparts. The Russell 1000 Index gained 5.4% during the month, while Russell 2000 Index returned 2.3%.
Foreign equities were broadly positive, leading those in the U.S. on tailwinds of currency movements relative to the U.S. dollar (USD) and strength in Chinese equities. Regarding the latter, China (+29.7%) rallied on signals that Beijing may be ready to move toward reopening. After nearly three years of a strict zero-COVID policy—and more recent civil unrest following a deadly apartment fire for which COVID policy was blamed for hampering rescue efforts—officials announced a relaxation of certain quarantine restrictions. This was despite a rising number of COVID cases. Segments of the market related to Chinese growth and consumption rallied during the month on these developments. The battered Chinese real estate sector (+60.3%) also benefited from a stronger government response, after the Chinese central bank announced a rescue package aimed at relieving pressure on developers and home buyers. Previously, government support was limited to the completion of defaulted projects.
Emerging markets (+14.8%) rebounded sharply on the aforementioned strength from China, which accounted for roughly 30% of the MSCI Emerging Markets Index during the month. Optimism in China rippled through the developed world, as well. The MSCI EAFE Index rose 11.3%, and sectors with significant revenue exposure to China, such as materials (+16.8%) and luxury goods (+23.5%), performed particularly well. Companies in the U.S. with similar Chinese exposure also benefited.
Currency movements, a severe headwind to non-U.S. equity returns for the year-to-date ended October 31st, reversed sharply on signals that the Fed would slow its pace of rate hikes and the dollar spot index fell 5.0%. The impact was most notable in the developed space, where the MSCI EAFE Index gained just 6.4% in local terms. The Japanese yen (+6.5), euro (+4.2%), British pound (+3.4%), Aussie dollar (+4.7%) and Swiss franc (+5.0%) gained ground on the USD.
Most real assets delivered strong performance during the month, led by listed infrastructure (+8.1%), global REITs (+6.8%), clean energy stocks (+11.0%), and metals and mining stocks (+21.6%).
Expectations that the Fed may begin to slow the pace of interest rate hikes helped drive advances in these categories. For REITs (and listed infrastructure), a stabilization in interest rates would likely improve the sectors’ growing cash flows relative attractiveness and may also improve debt availability and costs. As rates have continued to increase in the second half of 2022, commercial real estate transaction markets have cooled considerably, as acquisition debt has been harder to access and has become significantly more expensive. A more restrained Fed could potentially stabilize markets and open up debt financing for the sector. REITs also benefited from still solid fundamentals, and ongoing revenue increases which in many property types continue to outpace inflation. Lastly, European and Asian REIT returns benefited from a weaker dollar.
Publicly traded clean energy stocks (+11.0%), which are a mix of infrastructure-like clean energy producers, clean energy developers, component manufacturers, and technology stocks, benefited from the combination of revised rate hike expectations, the roll out of clean energy tax credits provided by the Inflation Reduction Act, and strong secular tailwinds in the sector.
In the natural resources sector, energy equities—which are up 70.7% year-to-date, trailed during the month, returning 1.3% as investors re-allocated capital to more yield sensitive asset classes. A pullback in crude prices (-6.7%) which remain highly volatile, served to offset a significant increase in natural gas prices (+38%). Metals and mining stocks strongly outperformed (+21.6%) on news of production/supply disruptions, news that China would provide support for its property sector—which is a significant source of demand for copper and other metals, and expectations that China will relax zero-COVID policies.