U.S. equities were modestly negative in July but experienced sharp internal volatility, particularly across AI-related technology stocks.
Semiconductors sold off heavily, while software rallied and value stocks significantly outperformed growth. Developed non-U.S. markets gained, while emerging markets declined as weakness in Korea and Taiwan offset strong Chinese performance.
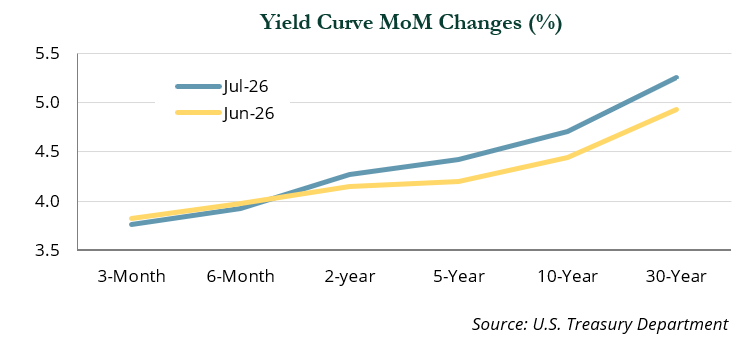
Fixed income also struggled as Treasury yields rose and the curve bear-steepened amid resilient economic growth, persistent inflation risks, and expectations for tighter-for-longer Fed policy. Long-duration bonds were hit hardest, while high yield proved relatively resilient and floating-rate leveraged loans gained.
Real assets generally fared better, led by energy and commodities, as renewed U.S.-Iran tensions pushed oil prices sharply higher.
Looking ahead, the key risks are geopolitical escalation, uncertainty around the durability of U.S. growth, and shifting expectations for monetary and fiscal policy.
Elevated equity valuations and tight credit spreads leave less room for disappointment, while market concentration and the approaching midterm election cycle could add further volatility, reinforcing the importance of diversification and disciplined underwriting.
Equities
While U.S. equities, as represented by the Russell 3000 (−0.5%) were down only slightly in July, the month was characterized by extreme volatility. This was most notable within IT (−3.7%), which continues to represent just over one-third of index assets. AI-related fears led to a sharp decline for semiconductors and semiconductor equipment (−12.3%) names that buoyed market gains during the first half of the year, with Micron Technology (−28.7%) and Intel (−35.4%) among notable decliners. Conversely, software (+14.0%) which has been punished in recent quarters due to fears related to market disruption, rallied. The software rally was largely driven by Microsoft’s (+24.6%) surge late in the month after the company reported strong revenue growth and announced it expects to be cash flow positive in 2027 despite significant capex spending.
Industrials (−4.6%) was the other notable sector to decline, driven by poor results across machinery (−8.9%) and electrical equipment (−14.2%). Defensive sectors held up better, notably energy (+11.9%), buoyed by rising oil prices and ongoing geopolitical risks, as well as financials (+5.7%) and, to a lesser degree, real estate (+2.5%), consumer staples (+2.2%) and healthcare (+1.7%).
The Russell 3000 Value Index (+3.7%) outperformed the Russell 3000 Growth Index (−4.8%), widening the year-to-date (“YTD”) gap between the two indices to 2,000 bps. The late June timing of the Russell reconstitution boosted results, as semiconductor and memory stocks that surged during the first half of the year are now growth constituents. While large caps meaningfully lagged small caps for the year through June, during July the Russell 2000 Index loss of 3.0% lagged the modest 0.4% decline for the Russell 1000 Index.
Developed non-U.S. equities (+2.0%) were relatively insulated from the selloff, as information technology (−15.1%) accounts for much smaller portion of the investable universe compared to the U.S. and emerging markets. With the exception of healthcare (−0.2%) and utilities (−0.6%), all other segments of the market were positive. Energy (+16.3%) was a standout, as renewed tensions in Iran caused a spike in oil prices. Japan (+1.0%) garnered headlines in July as the yen (+2.1%) slid to multi-decade lows during the month, prompting a rare instance of joint intervention between Japan and the U.S. to stabilize the currency. The yen rebounded sharply in the closing days, but long-term pressure persists amidst policy expectations and the likely continuation of the carry trade.
Emerging markets declined 3.1%, primarily due to Korea (−17.1%) and Taiwan (−5.4%) as the global AI trade unwound. In Korea, weaker-than-expected earnings from SK Hynix (−29.6%), intensifying competition from Chinese memory chip producers, and growing concerns over AI-related valuations triggered broad selling, particularly by retail investors following a sharp YTD rally. Despite the correction, Korea remains the best-performing emerging market country YTD, up 81.2%.
China (+9.0%) was more nuanced than its headline return suggests. Strong gains in offshore internet and consumer platform companies, including Alibaba (+26.0%) and Tencent (+10.6%), drove the broader market higher, supported by improving earnings expectations, AI monetization, easing regulatory concerns, and attractive valuations. Beneath the surface, however, market dynamics within China’s tech sector reflected the same weakness seen across global markets. China’s IT sector declined 18.4% as investors rotated out of semiconductor and other AI “pick-and-shovel” names. While the highly anticipated IPO of domestic memory chipmaker, CXMT, briefly lifted sentiment towards month-end, the rally was short-lived. This broad market rotation contributed to a notable divergence between the MSCI EM Growth (−5.3%) and MSCI EM Value (-0.7%) indices during the month.
Fixed Income
Fixed income struggled in July, as Treasury yields rose sharply and the yield curve underwent bear steepening. Markets continued to price in a higher-for-longer interest rate outlook as resilient economic growth and a still-tight labor market, with the unemployment rate holding at 4.2%, reinforced the case for restrictive monetary policy. Although lower energy prices helped moderate inflation during the month, upside inflation risks remained elevated given the unresolved conflict in the Middle East.
At its July 28–29 meeting, the Federal Reserve left rates unchanged, though three officials dissented. Meanwhile, Fed Chair Warsh offered little forward guidance regarding the Fed’s reaction function. In response, Treasury yields moved higher following the meeting, as markets shifted expectations for a potential hike to the Fed’s September meeting.
The selloff in rates was led by longer-dated Treasuries, resulting in a pronounced bear steepening of the yield curve. The 2-year Treasury yield rose 12 basis points to 4.27%, while the 10-year yield increased 27 basis points to 4.71%. Meanwhile, the 30-year Treasury yield climbed 32 basis points to 5.25%, its highest level since 2007. Notably, the move was driven by higher real yields rather than rising inflation expectations as the 10-year TIPS yield increased 27 basis points to 2.47%, while the 10-year breakeven inflation rate was little changed at 2.24%. The rise in real yields likely reflected factors including elevated Treasury issuance, persistent fiscal deficits, and uncertainty regarding the Fed’s policy outlook.
Accordingly, long-duration asset performance was most challenged during the month. Long treasuries declined 4.0%, compared with a loss of 1.1% for 5–10 year Treasuries, while 1–3 year Treasuries posted a modest gain of +0.1%. Investment-grade corporates returned −1.7%, while agency MBS, CMBS, and ABS declined 1.4%, 0.4%, and 0.1%, respectively. As a result, the Bloomberg U.S. Aggregate Index fell 1.3% during the month.
Despite broad weakness across fixed income, below investment-grade credit held up relatively well, supported by shorter duration profiles and only modest spread widening, with high yield spreads widening 9 basis points to 279 bps. Consequently, high yield bonds declined just 0.2%, while leveraged loans saw positive performance, gaining 1.2% on the back of their floating-rate profile.
Real Assets
Real assets generally outperformed broader markets in July, with energy (+12.6%) leading all S&P 500 GICS sectors, not only for the month, but also on a YTD and trailing one-year basis. The price of Brent Crude jumped 20.5% as the U.S.-Iran war reignited, following a fragile peace deal in late June which had partially reopened traffic through the Strait of Hormuz. Energy futures jumped 15.6% and agriculture futures rose by 6.0% in response.
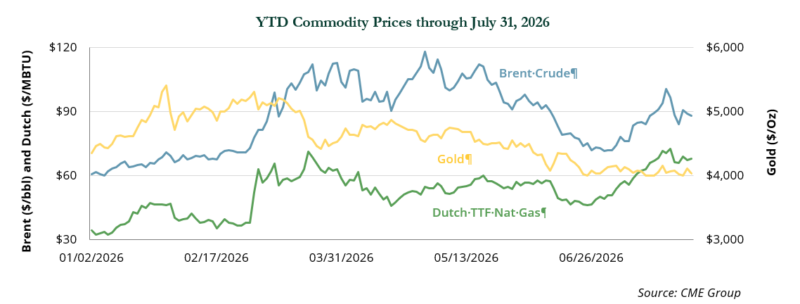
Commodities gained 7.5% as livestock futures (−2.7%) and precious metals (−0.1%) detracted. Gold (+0.7%) was little changed and is down 6.4% YTD, while remaining positive over the trailing one-year (+23.0%) following a sustained rally through early 2026. We believe the recent correction in gold can be attributed to investors taking profits, and a growing belief that the Fed may hike rates over the near- to medium-term, which increases the opportunity cost of holding a non-yielding asset.
Infrastructure (+0.2%) was flat for the month, while MLPs gained 7.6% on rising U.S. LNG exports and growing natural gas demand to power data centers, in addition to higher commodity prices. Natural resource equities gained 6.9% as moderate increases to metals and mining equities (+1.9%) coincided with traditional energy strength.
Clean energy (−14.1%) saw a significant pullback, but trailing one-year returns remained strong at 33.0%. Clean energy performance has been largely driven by Bloom Energy (−32.0%), which designs and manufactures solid oxide fuel cells for onsite power generation. The company has been a clear beneficiary of the growth in AI and may continue to experience ongoing volatility as investors take profits and attempt to gauge its valuation.
Global REITs added 2.7%. with non-U.S. regions outperforming, partially due to currency effects. UK REITs (+7.5%) led all developed regions, with Asia REITs up 4.7% and Europe REITs up +3.6%. Within U.S. REITs (+2.3%), most sectors were positive, with industrial REITs (+6.1%) leading all sectors – data centers (−0.1%) were flat, while apartments notably declined by 2.6% amidst rising operating expenses and slowing rent growth. U.S. REITs have outperformed global REITs on a YTD basis (+20.3% vs. +12.6%) as the cyclical recovery continued, aided by fewer new construction starts and improved debt market access. ⬛
Indices referenced are unmanaged and cannot be invested in directly. Index returns do not reflect any investment management fees or transaction expenses. Copyright MSCI 2026. Unpublished. All Rights Reserved. This information may only be used for your internal use, may not be reproduced or redisseminated in any form and may not be used to create any financial instruments or products or any indices. This information is provided on an “as is” basis and the user of this information assumes the entire risk of any use it may make or permit to be made of this information. Neither MSCI, any of its affiliates or any other person involved in or related to compiling, computing or creating this information makes any express or implied warranties or representations with respect to such information or the results to be obtained by the use thereof, and MSCI, its affiliates and each such other person hereby expressly disclaim all warranties (including, without limitation, all warranties of originality, accuracy, completeness, timeliness, non-infringement, merchantability and fitness for a particular purpose) with respect to this information. Without limiting any of the foregoing, in no event shall MSCI, any of its affiliates or any other person involved in or related to compiling, computing or creating this information have any liability for any direct, indirect, special, incidental, punitive, consequential or any other damages (including, without limitation, lost profits) even if notified of, or if it might otherwise have anticipated, the possibility of such damages. Bloomberg Index Services Limited. BLOOMBERG® is a trademark and service mark of Bloomberg Finance L.P. and its affiliates (collectively “Bloomberg”). Bloomberg or Bloomberg’s licensors own all proprietary rights in the Bloomberg Indices. Bloomberg does not approve or endorse this material, or guarantee the accuracy or completeness of any information herein, or make any warranty, express or implied, as to the results to be obtained therefrom and, to the maximum extent allowed by law, it shall not have any liability or responsibility for injury or damages arising in connection therewith. Copyright ©2026, S&P Global Market Intelligence (and its affiliates, as applicable). Reproduction of any information, data or material, including ratings (“Content”) in any form is prohibited except with the prior written permission of the relevant party. Such party, its affiliates and suppliers (“Content Providers”) do not guarantee the accuracy, adequacy, completeness, timeliness or availability of any Content and are not responsible for any errors or omissions (negligent or otherwise), regardless of the cause, or for the results obtained from the use of such Content. In no event shall Content Providers be liable for any damages, costs, expenses, legal fees, or losses (including lost income or lost profit and opportunity costs) in connection with any use of the Content. A reference to a particular investment or security, a rating or any observation concerning an investment that is part of the Content is not a recommendation to buy, sell or hold such investment or security, does not address the suitability of an investment or security and should not be relied on as investment advice. Credit ratings are statements of opinions and are not statements of fact. FTSE International Limited (“FTSE”) © FTSE 2026. FTSE® is a trademark of the London Stock Exchange Group companies and is used by FTSE under license. All rights in the FTSE indices and / or FTSE ratings vest in FTSE and/or its licensors. Neither FTSE nor its licensors accept any liability for any errors or omissions in the FTSE indices and / or FTSE ratings or underlying data. No further distribution of FTSE Data is permitted without FTSE’s express written consent. © 2026 HFR, Inc. – All rights reserved. HFR®, HFRI®, HFRX®, HFRU®, Hedge Fund Research®, HFR IndexScope®, and HFR Risk Parity Indices® are the trademarks of HFR, Inc.This information is obtained from sources that HFR considers to be reliable; however, no representation is made as to, and no responsibility or liability is accepted for, the accuracy or completeness of the information. Information contained herein is subject to change at any time without notice. It is not possible to invest directly in a financial index. Exposure represented by an index is available through instruments based on that index. HFR does not sponsor, endorse, sell, promote or manage any investment products. Frank Russell Company (“Russell”) is the source and owner of the trademarks, service marks and copyrights related to the Russell Indexes. Russell® is a trademark of Frank Russell Company. Neither Russell nor its licensors accept any liability for any errors or omissions in the Russell Indexes and / or Russell ratings or underlying data and no party may rely on any Russell Indexes and / or Russell ratings and / or underlying data contained in this communication. No further distribution of Russell Data is permitted without Russell’s express written consent. Russell does not promote, sponsor or endorse the content of this communication. Nasdaq® is a registered trademark of Nasdaq, Inc. The information contained above is provided for informational and educational purposes only, and nothing contained herein should be construed as investment advice, either on behalf of a particular security or an overall investment strategy. Neither Nasdaq, Inc. nor any of its affiliates makes any recommendation to buy or sell any security or any representation about the financial condition of any company. Statements regarding Nasdaq-listed companies or Nasdaq proprietary indexes are not guarantees of future performance. Actual results may differ materially from those expressed or implied. Past performance is not indicative of future results. Investors should undertake their own due diligence and carefully evaluate companies before investing. All commentary contained within is the opinion of Prime Buchholz and is intended for informational purposes only; it does not constitute an offer, nor does it invite anyone to make an offer, to buy or sell securities. The content of this report is current as of the date indicated and is subject to change without notice. It does not take into account the specific investment objectives, financial situations, or needs of individual or institutional investors. Some statements in this report that are not historical facts are forward-looking statements based on current expectations of future events and are subject to risks and uncertainties that could cause actual results to differ materially from those expressed or implied by such statements. Information obtained from third-party sources is believed to be reliable; however, the accuracy of the data is not guaranteed and may not have been independently verified. Performance returns are provided by third-party data sources. Past performance is not an indication of future results. Nothing herein should be construed as a guarantee of future results. Prime Buchholz LLC © 2026