Equity markets extended their winning streak as investors continued to favor risk assets, particularly those tied to AI and tech innovation. Market leadership remained concentrated in high-growth sectors, while value-oriented and defensive areas lagged.
Investor confidence appeared supported by strong corporate earnings and a persistent belief in the long-term potential of technology-driven growth.
In fixed income, the tone shifted toward cautious optimism with the Fed’s latest rate cut and planned resumption of quantitative easing. The yield curve’s behavior reflected confidence in long-term stability but also some caution about near-term economic headwinds. Credit markets remained stable, with modest widening suggesting selective risk-taking rather than broad concern. Overall, investors appeared to be adjusting to a slower, more deliberate policy environment that prioritizes sustainability over speed.
Real assets delivered a more nuanced story. Real estate softened slightly as economic uncertainty and slowing rent growth weighed on sentiment, but areas tied to AI continued to attract investor enthusiasm.
Energy markets reflected the crosscurrents of changing demand dynamics, with clean energy emerging as a standout beneficiary of technological progress and the global shift toward electrification.
The renewed attention to sustainable infrastructure and renewable energy highlighted growing confidence in long-term transformation themes.
Equities
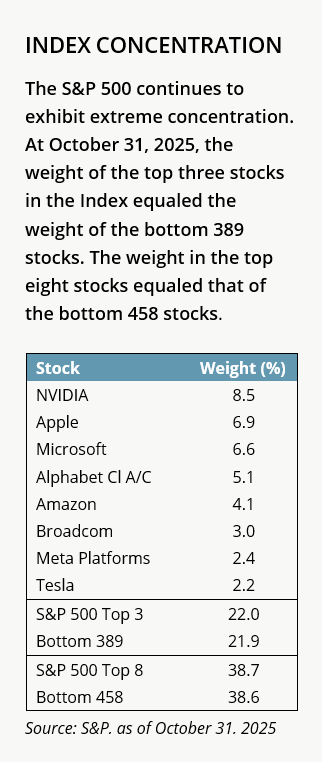 Domestic equity markets posted their sixth consecutive month of gains in October. The S&P 500 Index returned 2.3%, while the broader Russell 3000 Index gained 2.1%. The risk-on trade that accounted for much of the year-to-date (YTD) gains remained in place in October.
Once again, high beta stocks outpaced defensive and quality names, and the AI theme maintained its market leadership. IT (+6.3%) was the best performing sector, primarily due to strong performance by semiconductors. Healthcare (+4.1%) was the only other sector to outpace the broad index, reflecting the narrow nature of the rally. Materials (−4.5%) and financials (−2.9%) were the two worst performing sectors, posting drawdowns for the second consecutive month.
With AI enthusiasm continuing to drive the markets, growth stocks outpaced their value counterparts. During October, the Russell 3000 Growth Index gained 3.5% vs. 0.4% for Russell 3000 Value. Growth stocks have gained 20.9% YTD versus 12.0% for value stocks. Large caps narrowly beat small caps for the month, with the Russell 1000 Index gaining 2.2% versus 1.8% for the Russell 2000 Index. Large caps returned 17.1% YTD versus 12.4% for small caps.
Developed non-U.S. markets rose 1.2% in U.S. dollar terms, with currency movements dampening what was a 3.4% gain in local terms. In addition to strength in technology (+7.5%), which persisted across markets, October saw broad improvements in the global geopolitical environment, highlighted by the ceasefire agreement between Israel and Hamas.
Investors in Japan (+3.4%) embraced the seemingly market friendly new Prime Minister, Sanae Takaichi after her surprise electoral win. In France (+0.9%), what was unfolding as a political crisis stabilized after Sebastien Lecornu was reappointed Prime Minister following a brief resignation.
Emerging markets rose 4.2% during the month. President Trump’s Asia tour appeared to boost market sentiment towards the region, though performance diverged across the nations. China (−3.8%) weighed on the index after trade tensions flared mid-month when Trump threatened 100% tariffs on Chinese imports, prompting a sharp sell-off before rebounding after both sides reached a preliminary one-year trade agreement.
Korea stood out as a top performer, surging 22.7% in the month amid strong AI-related momentum and supportive policy measures including corporate governance reform. Recent performance brings Korea’s year to date return to +92.5%, making it the best performing global market by a wide margin during the period. India (+4.4%) also outperformed, buoyed by earnings momentum and optimism following rate cuts.
Fixed Income
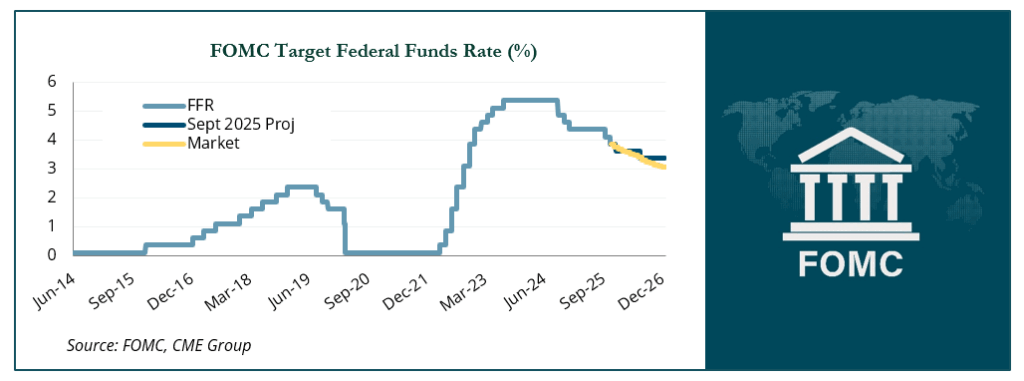
The Federal Open Market Committee held its two-day meeting during the last week of October. As was widely expected, the FOMC cut rates by 25 bps to a range of 3.75-4.00%. A combination of heavy Treasury bill issuance and quantitative tightening (QT) has caused rates in the funding markets to be elevated and volatile as bank reserves are drained from the system. The Fed believes it is near its goal of “ample reserves” and reported that QT will end on December 1, 2025. There were two dissents at the meeting, with Governor Stephen Miran continuing to push for a 50 bp cut and Federal Reserve Bank of Kansas City President preferring to leave rates unchanged.
As the table below shows, the market agrees with Fed guidance for up to one more rate cut in 2025 but, while the FOMC expects to cut only once in 2026, market consensus is that at least two cuts will be needed next year.
Treasury yields fell in October and the curve underwent a bullish flattening, where the drop in yields for the long term portion were larger than the declines observed at the front-end and in the belly of the curve.
As a result of this shift in the curve, long-term Treasuries rose 1.3% for the month outpacing the 0.6% rise of Treasuries in the 5-10 year segment of the curve and a 0.3% increase for those maturing in the next 1-3 years.
Outside of a modest drop in Agency MBS, credit spreads ticked higher in October, with a notable 14 bps rise in high yield corporates. Investment-grade corporate spreads rose 4 bps and, as a result, the 0.4% gain in investment-grade corporates exceeded the 0.2% rise in high yield corporates. In securitized, Agency MBS gained 0.9% and outperformed the 0.5% return in CMBS and 0.4% increase in ABS.
Real Assets
Real assets delivered mixed returns in October. Global real estate fell 1.5%, bringing YTD returns to +8.7%. Asian REITs (−2.0%) pulled back after strong YTD performance (+31.6%), while U.K. REITs (+0.4%) rose modestly.
Despite the rate cut in October, U.S. REITs fell 1.6% on concerns of a labor market slowdown and lower residential rent growth. Apartment REITs fell 7.7% and office REITs were down 6.8%, with most other subsectors seeing a range of declines. Industrial REITs (+6.8%) performed well on continued strong demand and limited new supply, while data center REITs (+3.9%) moved higher on the rapid expansion of AI and strong earnings.
Gold advanced 3.7%, after briefly eclipsing $4,300 per ounce, before ending the month at just under $4,000. The government shutdown has further increased the market’s appetite for safe-haven assets like gold, as investors fear potential impacts to the GDP.
Natural gas was up 19.9%, mainly from weather-related activity – the price of the volatile commodity has jumped 117.5% over the trailing one-year period, ending the month at $4.0 per million Btus. Some market participants expect a higher floor for gas prices over the medium- to long-term, as the EIA expects U.S. LNG export capacity to double by 2029.
Despite increased volume projection, MLPs shed 0.7%. WTI Crude (−2.2%) and Brent Crude (−1.9%) prices saw further pressure, as OPEC+ continued to wind down production cuts. Increased buying from China may have provided a floor for prices, as the country aims to increase its strategic oil reserves.
North American natural resource equities fell 2.8% in October. Commodities (+2.9%) were generally higher across the board, with the exception of the livestock subindex (−3.8%). The industrial metals (+4.8%) and agriculture (+4.6) subindexes both outpaced the broader index. Global mining (+0.5%) and infrastructure equities (-0.3%) were little changed.
Clean Energy Gains
Clean energy, as measured by the performance of the S&P Global Clean Energy Transition Index, advanced 11.9% in October, bringing YTD gains to 53.7%. This comes after four straight calendar years of negative returns from 2021-2024, which followed two years of investor exuberance in 2019 and 2020.
Rising power demand and future growth projections have helped to fuel a renewed appreciation for clean energy. We believe this is due to the electrification of industries and fleets, the onshoring of manufacturing, and data center growth driven by AI and corporate demand for cloud services. A positive industry sentiment is forming around a belief that every available electron will be needed to meet the potential for unprecedented growth in power demand.
October gains were primarily driven by Bloom Energy, which is up nearly 500% YTD and now the top holding in the index. Bloom Energy provides behind-the-meter power to data centers, with its recent success highlighting the current demand-supply imbalance of the sector. Stronger-than-expected earnings from First Solar, the Index’s former top holding, were also additive.
While the OBBBA accelerated the phase-out of several investment tax credits, including those for wind and solar, it left some incentives intact – notably, those for battery storage investments. More importantly, the passing of the bill provided clarity for clean energy developers after a quiet second quarter marked by regulatory uncertainty.
YTD performance has also benefited from a falling dollar, given the index’s heavy non-U.S. exposure, which stood at approximately 69% on September 30, 2025. Despite volatility, the three- and five-year annualized performance figures for the index stood at −1.1% and −0.7% respectively at month-end. ⬛
Indices referenced are unmanaged and cannot be invested in directly. Index returns do not reflect any investment management fees or transaction expenses. Copyright 2025 FactSet. All rights reserved. Copyright MSCI 2025. Unpublished. All Rights Reserved. This information may only be used for your internal use, may not be reproduced or redisseminated in any form and may not be used to create any financial instruments or products or any indices. This information is provided on an “as is” basis and the user of this information assumes the entire risk of any use it may make or permit to be made of this information. Neither MSCI, any of its affiliates or any other person involved in or related to compiling, computing or creating this information makes any express or implied warranties or representations with respect to such information or the results to be obtained by the use thereof, and MSCI, its affiliates and ech such other person hereby expressly disclaim all warranties (including, without limitation, all warranties of originality, accuracy, completeness, timeliness, non-infringement, merchantability and fitness for a particular purpose) with respect to this information. Without limiting any of the foregoing, in no event shall MSCI, any of its affiliates or any other person involved in or related to compiling, computing or creating this information have any liability for any direct, indirect, special, incidental, punitive, consequential or any other damages (including, without limitation, lost profits) even if notified of, or if it might otherwise have anticipated, the possibility of such damages. © 2025 World Gold Council. All rights reserved. World Gold Council and the Circle device are trademarks of the World Gold Council or its affiliates. The World Gold Council and its affiliates do not guarantee the accuracy or completeness of any information nor accept responsibility for any losses or damages arising directly or indirectly from the use of this information. Bloomberg Index Services Limited. BLOOMBERG® is a trademark and service mark of Bloomberg Finance L.P. and its affiliates (collectively “Bloomberg”). Bloomberg or Bloomberg’s licensors own all proprietary rights in the Bloomberg Indices. Bloomberg does not approve or endorse this material, or guarantee the accuracy or completeness of any information herein, or make any warranty, express or implied, as to the results to be obtained therefrom and, to the maximum extent allowed by law, it shall not have any liability or responsibility for injury or damages arising in connection therewith. Copyright ©2025, S&P Global Market Intelligence (and its affiliates, as applicable). Reproduction of any information, data or material, including ratings (“Content”) in any form is prohibited except with the prior written permission of the relevant party. Such party, its affiliates and suppliers (“Content Providers”) do not guarantee the accuracy, adequacy, completeness, timeliness or availability of any Content and are not responsible for any errors or omissions (negligent or otherwise), regardless of the cause, or for the results obtained from the use of such Content. In no event shall Content Providers be liable for any damages, costs, expenses, legal fees, or losses (including lost income or lost profit and opportunity costs) in connection with any use of the Content. A reference to a particular investment or security, a rating or any observation concerning an investment that is part of the Content is not a recommendation to buy, sell or hold such investment or security, does not address the suitability of an investment or security and should not be relied on as investment advice. Credit ratings are statements of opinions and are not statements of fact. FTSE International Limited (“FTSE”) © FTSE 2025. FTSE® is a trademark of the London Stock Exchange Group companies and is used by FTSE under license. All rights in the FTSE indices and / or FTSE ratings vest in FTSE and/or its licensors. Neither FTSE nor its licensors accept any liability for any errors or omissions in the FTSE indices and / or FTSE ratings or underlying data. No further distribution of FTSE Data is permitted without FTSE’s express written consent. Frank Russell Company (“Russell”) is the source and owner of the trademarks, service marks and copyrights related to the Russell Indexes. Russell® is a trademark of Frank Russell Company. Neither Russell nor its licensors accept any liability for any errors or omissions in the Russell Indexes and / or Russell ratings or underlying data and no party may rely on any Russell Indexes and / or Russell ratings and / or underlying data contained in this communication. No further distribution of Russell Data is permitted without Russell’s express written consent. Russell does not promote, sponsor or endorse the content of this communication. All commentary contained within is the opinion of Prime Buchholz and is intended for informational purposes only; it does not constitute an offer, nor does it invite anyone to make an offer, to buy or sell securities. The content of this report is current as of the date indicated and is subject to change without notice. It does not take into account the specific investment objectives, financial situations, or needs of individual or institutional investors. Some statements in this report that are not historical facts are forward-looking statements based on current expectations of future events and are subject to risks and uncertainties that could cause actual results to differ materially from those expressed or implied by such statements. Information obtained from third-party sources is believed to be reliable; however, the accuracy of the data is not guaranteed and may not have been independently verified. Performance returns are provided by third-party data sources. Past performance is not an indication of future results. Prime Buchholz LLC © 2025