Global equity markets experienced sharp volatility in April following President Trump’s tariff announcement. U.S. equities initially plunged, but rebounded after policy walk-backs, though major indexes still closed slightly negative. Large cap and growth stocks outperformed, while energy and healthcare lagged. Foreign equities gained for U.S. investors due to dollar weakness, with EU and Asian markets showing strength; China declined amid retaliatory tensions.
Fixed income markets experienced yield volatility, with intermediate-term Treasuries outperforming. Credit spreads widened, but securitized assets posted modest gains. Real asset performance was mixed: U.S. REITs fell, while data centers and European REITs surged. Commodities dropped, led by falling oil and gas prices, while gold hit record highs, buoyed by geopolitical uncertainty.
Overall, soft economic data and recession fears, combined with corporate caution and persistent valuation concerns, suggest a challenging outlook.
Equities
President Trump’s initial tariff announcement on April 2 triggered a rollercoaster ride for global equity markets. Over the four trading days that followed, the S&P 500 posted a drawdown of over 12.0%, which put the index within striking distance of entering a bear market. When the administration walked back the initial announcement on April 9, sentiment shifted sharply – the S&P 500 gained 9.5% on the day, its best one-day showing since October 2008. With investors’ fears partly assuaged, domestic equities recovered most of their losses over the rest of the month; however, both the S&P 500 (−0.7%) and the broader Russell 3000 Index (−0.7%) finished in the red for the third consecutive month.
Large and mid cap equities outpaced small caps, with the Russell 1000 Index declining 0.6% versus 2.3% for the Russell 2000 Index. After getting off to a strong start in the first quarter of the year, value stocks lagged their growth counterparts in April: the Russell 3000 Value Index declined 3.1% vs. a gain of 1.7% for Russell 3000 Growth. Energy (−13.4%) was by far the worst performing sector amid sharply lower oil and gas prices. Healthcare (−3.2%) also lagged, dragged down by an earnings miss and lowered guidance from managed care giant UnitedHealth Group (−21.4%). Growth-oriented IT (+1.7%) and defensive consumer staples (+1.2%) were the two best performing sectors for the month.
Foreign markets experienced similar volatility, but local market weakness was more than offset by currency movements, as the U.S. dollar sank 4.6% on uncertainty and damage to investor confidence that came from Trump’s announcement. The MSCI EAFE, down 0.1% in local terms, returned +4.6% or U.S. investors. The European Union continued its strong start to 2025, up 5.0% in April, helped not only by strength in the euro (+5.2% vs. USD) but also better than expected GDP growth.
Emerging markets (+1.3%) were also resilient, despite Asian nations receiving some of the most aggressive tariffs by the administration. Volatility and uncertainty remained elevated throughout the month. Most markets turned positive once a 90-day pause on most tariffs was implemented and transparency improved around exemptions for key sectors such as semiconductors and pharma. Tech-heavy markets such as Taiwan (+2.4%) and Korea (+4.7%) were among the top performers during the period. India (+4.8%), which made it through tariff threats relatively unscathed, was a standout performer, as it stands to benefit from global supply chain diversification. China (−4.6%) was an exception, as what started as a global trade war quickly shifted focus to China after Beijing took a harsh stance against the U.S. and triggered “tit for tat” retaliatory tariffs. Officials did step in to support the equity market, but stopped short of widely expected additional stimulus and weighed further on sentiment.
Fixed Income
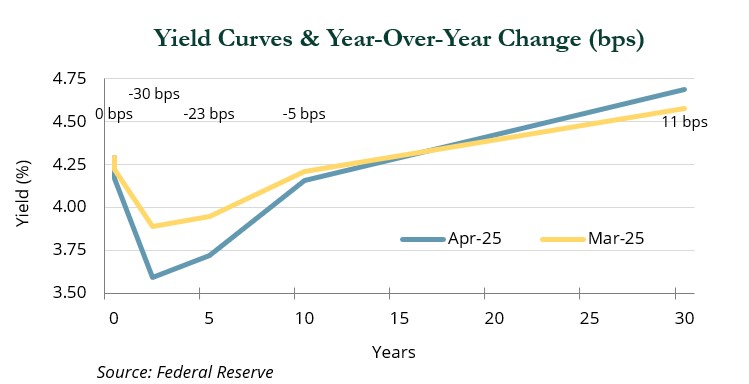
Interest rates were volatile in April. Yields entered the month by continuing the downtrend that began in late March. However, the magnitude of the reciprocal tariffs announced on April 2 surprised markets and led to a 50 bps increase in the 10-year U.S. Treasury yield—from 3.99% on April 4, to 4.49% a week later—as markets focused on the inflationary impact of the tariffs.
As attention turned to the tit-for-tat responses from trading partners and began considering the potential negative growth impact of trade disruptions, yields began to fall again, leading to the 10-year Treasury yield ending the month at 4.16%. The very long-end of the curve, 30-year Treasuries, followed a similar pattern as its shorter-dated cohorts, but ended April 11 bps higher than March.
The greatest drop in yields occurred in the belly of the curve, with 2-year Treasuries falling 30 bps and f-year Treasuries falling 23 bps. The curve steepened with the difference between 2-year Treasuries and 10-year Treasuries—the “2s10s” spread—rose 25 bps, while the difference between 5-year Treasuries and 30-year Treasuries—the 5s30s spread—increased 34 bps.
As a result of the changes in the shape of the curve, intermediate-term Treasuries, those that mature in the next 5-10 years, rose 1.2% and outperformed both the +0.8% return of short-term Treasuries (1-3 years) and the +0.4% in the 3-month T-bill. Long-term Treasuries fell 1.1% in April.
Credit markets saw wider spreads across all areas of fixed income, with a 37 bps increase in high yield, a 12 bps rise in investment-grade corporates, and a 7 bps, 9 bps, and 15 bps increase in MBS, CMBS, and ABS, respectively. High yield offers extra carry and delivered a flat return, while investment-grade fell 0.03% (3 bps) in the month. Securitized assets delivered positive returns despite wider spreads, with a 0.9% gain in CMBS, a +0.5% rise in ABS, and a +0.3% increase in MBS.
Real Assets
While real assets have generally outperformed broad markets year-to-date, returns were mixed across subcategories during the month of April. Global REITs were up 1.0%, lifted by international markets, while U.S. REITs (−2.6%) fell on lower growth expectations. Industrial REITs (−9.3%) were among the worst performing sectors on fears that a slowdown in global trade could negatively impact REITs with sizable exposures to imports.
Despite stronger than expected leasing activity in Q1, Office REITs fell 6.7% as increased recession odds raised concerns about near-term demand. Data centers (+8.0%) rebounded after a sharp decline in recent months, as hyperscalers’ (i.e., Amazon, Microsoft, Google, others) AI-related capital expenditure plans remained largely intact.
Telecom REITs (+4.5%) benefitted from their relative resilience to tariffs, strong cell carrier leasing activity, and investors rotating to defensive markets. European REITs (+11.4%) advanced as the ECB cut rates for the third time in 2025. Like most asset classes, non-U.S. REITs generally benefited from a weaker U.S. dollar. Asian REITs gained 6.0%.
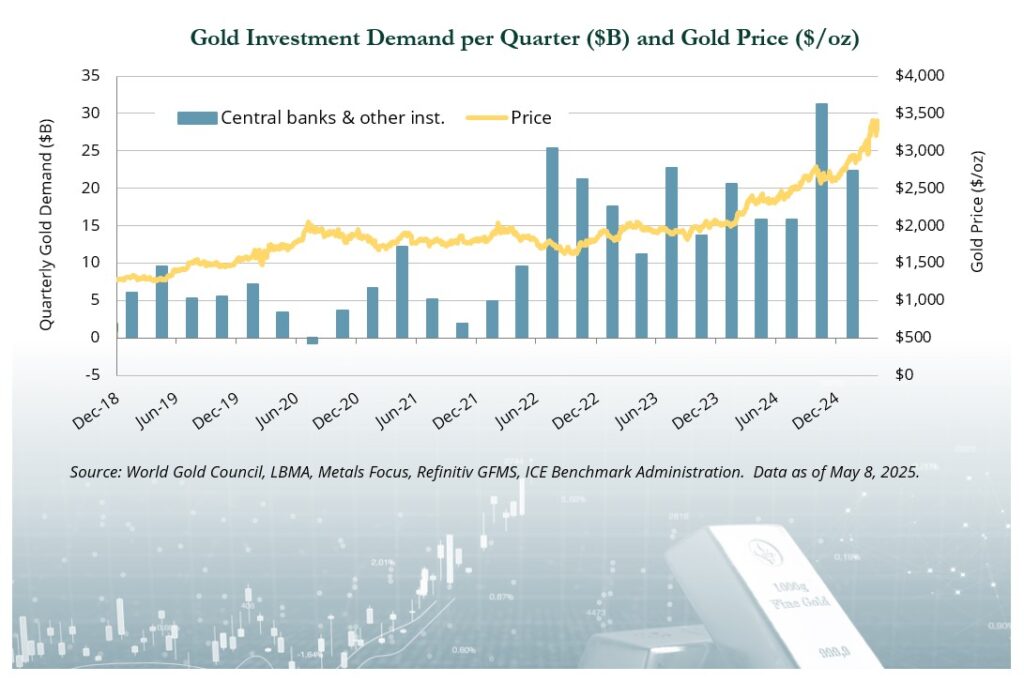
Global infrastructure (+3.7%) and global clean energy (+3.5%) both benefitted from currency effects as well, in addition to increased fiscal commitments to the sectors by foreign governments. Gold rose another 5.8%, finishing the month north of $3,300 per ounce. On April 22nd, it reached an all-time high, briefly eclipsing $3,500 per ounce. Gold has continued to be a safe haven asset during a highly uncertain political environment, and central bank buying has increased as institutions look to diversify away from U.S. Treasuries.
Commodities (−4.8%) were pulled lower by the steep declines of the energy subindex (−16.2%) and the industrial metals subindex (−6.9%). The precious metals subindex was up 3.1%. WTI crude oil prices fell 18.6%, finishing the month just above $58 dollars per barrel, the lowest since February 2021. The drop in prices was mainly attributable to tariff developments pushing down global growth expectations and OPEC+, which began unwinding voluntary production cuts.
North American natural resource equities fell 8.2% on lower oil prices during the month. At prices below 60 dollars per barrel, producers may begin to scale back drilling until stronger unit economics return.
Consistent with oil, natural gas prices were down 19.0% on the month due to concerns that medium-term liquified natural gas demand would fall due to announced tariffs.
Indices referenced are unmanaged and cannot be invested in directly. Index returns do not reflect any investment management fees or transaction expenses. Copyright MSCI 2025. Unpublished. All Rights Reserved. This information may only be used for your internal use, may not be reproduced or redisseminated in any form and may not be used to create any financial instruments or products or any indices. This information is provided on an “as is” basis and the user of this information assumes the entire risk of any use it may make or permit to be made of this information. Neither MSCI, any of its affiliates or any other person involved in or related to compiling, computing or creating this information makes any express or implied warranties or representations with respect to such information or the results to be obtained by the use thereof, and MSCI, its affiliates and ech such other person hereby expressly disclaim all warranties (including, without limitation, all warranties of originality, accuracy, completeness, timeliness, non-infringement, merchantability and fitness for a particular purpose) with respect to this information. Without limiting any of the foregoing, in no event shall MSCI, any of its affiliates or any other person involved in or related to compiling, computing or creating this information have any liability for any direct, indirect, special, incidental, punitive, consequential or any other damages (including, without limitation, lost profits) even if notified of, or if it might otherwise have anticipated, the possibility of such damages. Bloomberg Index Services Limited. BLOOMBERG® is a trademark and service mark of Bloomberg Finance L.P. and its affiliates (collectively “Bloomberg”). Bloomberg or Bloomberg’s licensors own all proprietary rights in the Bloomberg Indices. Bloomberg does not approve or endorse this material, or guarantee the accuracy or completeness of any information herein, or make any warranty, express or implied, as to the results to be obtained therefrom and, to the maximum extent allowed by law, it shall not have any liability or responsibility for injury or damages arising in connection therewith. Copyright ©2025, S&P Global Market Intelligence (and its affiliates, as applicable). Reproduction of any information, data or material, including ratings (“Content”) in any form is prohibited except with the prior written permission of the relevant party. Such party, its affiliates and suppliers (“Content Providers”) do not guarantee the accuracy, adequacy, completeness, timeliness or availability of any Content and are not responsible for any errors or omissions (negligent or otherwise), regardless of the cause, or for the results obtained from the use of such Content. In no event shall Content Providers be liable for any damages, costs, expenses, legal fees, or losses (including lost income or lost profit and opportunity costs) in connection with any use of the Content. A reference to a particular investment or security, a rating or any observation concerning an investment that is part of the Content is not a recommendation to buy, sell or hold such investment or security, does not address the suitability of an investment or security and should not be relied on as investment advice. Credit ratings are statements of opinions and are not statements of fact. FTSE International Limited (“FTSE”) © FTSE 2025. FTSE® is a trade mark of the London Stock Exchange Group companies and is used by FTSE under license. All rights in the FTSE indices and / or FTSE ratings vest in FTSE and/or its licensors. Neither FTSE nor its licensors accept any liability for any errors or omissions in the FTSE indices and / or FTSE ratings or underlying data. No further distribution of FTSE Data is permitted without FTSE’s express written consent. Indices referenced are unmanaged and cannot be invested in directly. All commentary contained within is the opinion of Prime Buchholz and is intended for informational purposes only; it does not constitute an offer, nor does it invite anyone to make an offer, to buy or sell securities. The content of this report is current as of the date indicated and is subject to change without notice. It does not take into account the specific investment objectives, financial situations, or needs of individual or institutional investors. Some statements in this report that are not historical facts are forward-looking statements based on current expectations of future events and are subject to risks and uncertainties that could cause actual results to differ materially from those expressed or implied by such statements. Information obtained from third-party sources is believed to be reliable; however, the accuracy of the data is not guaranteed and may not have been independently verified. Performance returns are provided by third-party data sources. Past performance is not an indication of future results. Prime Buchholz LLC© 2025