BY ROBERT THOMPSON, CAIA
Principal/Sr. Director, Research – Flexible Capital
We often look at credit markets as an indicator of investor risk appetite and for signals that cracks in the economy are not yet reflected in equity markets. Given recent equity market volatility and heightened uncertainty related to tariffs, what are credit markets telling us now?
In this paper, we explore what recent movements in credit spreads and default trends reveal about shifting investor sentiment and underlying market stress. We focus on the divergence between fixed and floating rate credit, the growing use of liability management exercises, and what these developments suggest about the resilience—or fragility—of credit markets heading into mid-2025.
Credit Spreads: Watch the Trend
Investors often speak of credit spreads when discussing valuations in the credit market. Tight spreads may indicate that the credit market is overvalued and wide spreads are often viewed as a buying opportunity. Investors generally use option-adjusted spreads, or “OAS”, when referring to investment-grade and high-yield bonds.
OAS is the difference in yield between a credit security and a corresponding Treasury security of the same maturity, adjusted for any option features of the credit security. In other words, it’s the excess yield investors require to purchase a risky security relative to a risk-free security.
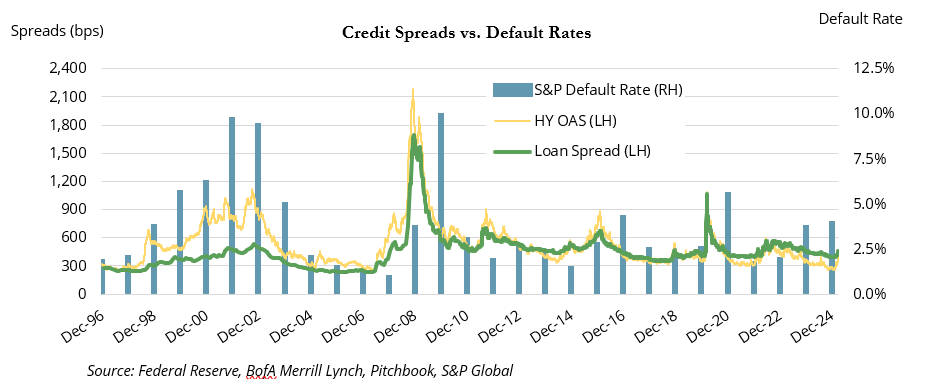
High-yield credit spreads entered 2025 near record low levels, indicating a high degree of risk appetite and optimism amongst credit investors. This largely mirrored the equity markets. However, this optimism started to fade in late March and changed dramatically in the first week of April following the rollout of Trump’s tariff plan.
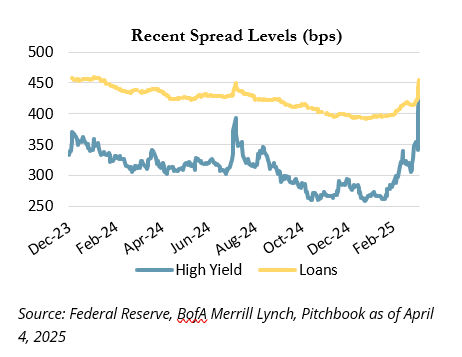
If we expand the chart further, we notice two things:
- Spreads are still low relative to history, but have moved up more than 150 bps from their lows earlier this year. This represents a move from the 1st percentile (259 bps on Jan. 22nd) to the 47th percentile as of April 4th (445 bps). Loan spreads moved up 60 bps from the 17th to 44th percentile over the same period.
- Prior periods of exceptionally low spreads have often been followed by significant risk-off environments and heightened defaults
It’s rare for credit spreads to be below 3%. In fact, since 1997, there are only three distinct periods where the HY credit spread stayed below 3% for more than thirty days:
- Feb 1997 – Dec. 1997: 318 days
- Dec. 2006 – July 2007: 200 days
- 2024 – March 2025: 157 days
The median HY spread since 1997 is roughly 460 bps and we are still below that level, indicating that investors are repricing credit risk, but, thus far, are not panicking.
However, it’s also important to consider that the high-yield market is sometimes considered to be a momentum/trend-following market. Once spreads start widening, there is often an extended spike higher as rising defaults lead to panic selling.
Investors are still processing the Trump tariffs and it is difficult to predict what will happen next. Default rates in the high-yield market are low relative to history, but that might not tell the whole story due to some shifts in the credit markets in recent years.
Structure Matters: Fixed > Floating
High-yield bonds are generally fixed-rate securities, meaning they are issued with a specific coupon rate and the borrower pays that rate for the life of the bond. The non-investment grade credit market also has floating rate securities in the form of leveraged loans (sometimes referred to as bank loans). Loans are typically senior securities, ranking them ahead of other forms of debt for payment priority. Loan yields are calculated as a spread over a floating-rate benchmark, most often the secured overnight financing rate (SOFR). SOFR is the cost of borrowing cash overnight collateralized by Treasury securities, so it often looks quite similar to the Fed Funds rate.
The difference between being a fixed-rate and a floating-rate borrower has become particularly topical in recent years due to the large moveup in yields. A borrower with a floating rate cost of capital has experienced a sizable shiftup in debt costs as interest rates have risen, while a fixed-rate borrower has not. This has led to an interesting dynamic in credit markets: High yield, which is often junior to leveraged loans in capital structures, is viewed as a higher quality and less risky asset class than senior loans.
We can see this dynamic reflected in the credit rating weights of the high-yield market. BB-rated credits, the highest quality credits in the high-yield market, now account for more than 50% of the HY index versus a long-term median of 43%. For comparison, only 28% of the leveraged loan market was rated BB or better at March 31, 2025). The relatively low levels of high-yield defaults in recent years reflect this upgrade in quality, but it may not tell the whole story of the credit markets.
Defaults: Mind The Gap
Low headline default rates and tight credit spreads would indicate that credit markets were quite placid prior to the last week. However, we believe a phantom default cycle has already begun in the loan market and aggressive tactics by credit investors may be masking additional stress in the market.
The graph below shows the rolling 12-month default rates for high-yield and leveraged loans.
We believe there are two key takeaways here:
- Loan defaults (floating rate) are much higher than high-yield defaults (fixed rate)
- The use of distressed exchanges might be suppressing reported default rates
The gap between loan and high-yield defaults is as wide as it has ever been. This makes sense when considering the increase in interest expense for floating-rate borrowers in recent years. However, the gap between actual defaults (i.e. companies missing payments, filing for bankruptcy, etc.) and distressed exchanges has also grown.
Distressed exchanges can be lumped in with another recent credit market phenomenon: liability management exercises (LMEs). In a distressed exchange, a company works with lenders to manage their liabilities in a way that allows it to avoid default on an upcoming payment that it otherwise would not have been able to make. In many instances, this involves the exchange of existing debt for new debt, hence a distressed exchange, or shifting collateral into new subsidiaries. However, LMEs can encompass a variety of maneuvers and can often be contentious. Tension can occur between the company and its creditors, as well as amongst the creditors themselves.
LMEs can help troubled borrowers buy time to turn their businesses around and meet future debt obligations. However, they are often ‘kick the can down the road’ exercises, delaying the inevitable. Pitchbook/LCD estimated that 33% of the borrowers who conducted an LME in 2022 had defaulted by YE 2024.
The leveraged loan market is now dominated by what is referred to as covenant-lite (cov-lite) issuance, meaning more than 90% of loans are issued with minimal covenants or protections for investors. This allows for LMEs and other credit market shenanigans, and lenders often have little recourse to protect themselves. Despite the heightened default rates in loans and the decline in quality in the market itself, leveraged loans experienced record new issuance in 2024, as investors chased the higher yields offered relative to fixed-rate high yield bonds.
Private Credit: Size Matters
We have largely focused on the broadly syndicated loan (BSL) market, which consists of liquid, publicly traded loans. However, private credit markets are also seeing an increase in defaults and cov-lite issuance. Law firm Proskauer Rose estimated that the default rate for private credit at year-end 2024 was 2.67%. However, this includes covenant breaches. Looking purely at payment defaults, the rate dropped to 1.2%, roughly in line with public loan markets.
The upper middle market of direct lending, typically encompassing companies with EBITDA over $100 million, has grown rapidly in recent years as large asset managers have raised large institutional funds, while also pushing into the retail world with fund structures offering lower minimums. Many of the largest lenders now compete with the BSL market for large cap loans, with loan sizes now growing beyond $1 billion. Direct lenders are able to compete in this space by offering speed and ease of execution, but they also must offer concessions on yield and covenants.
Lenders in the core ($25-100M in EBITDA) and lower middle-market ($25M or less in EBITDA) tend to have less competition and still command covenants on loans. However, these risks must be weighed against the smaller sizes of the businesses themselves during more trying economic conditions.
Recommendations
While recent default cycles have been short and sporadic, the combination of sustained higher interest rates and years of loose underwriting could signal a shift toward more prolonged stress in credit markets. In this environment, we believe distressed and opportunistic credit strategies may offer compelling entry points. Further spread widening and rising defaults would create headwinds for long-only credit strategies. Though direct lending continues to attract capital, investors should remain selective and expect volatility – credit expertise and a thoughtful approach to structure and collateral are critical. With elevated rates and persistent uncertainty, this is a time for discipline, not for chasing yield.
Bloomberg Index Services Limited. BLOOMBERG® is a trademark and service mark of Bloomberg Finance L.P. and its affiliates (collectively “Bloomberg”). Bloomberg or Bloomberg’s licensors own all proprietary rights in the Bloomberg Indices. Bloomberg does not approve or endorse this material, or guarantee the accuracy or completeness of any information herein, or make any warranty, express or implied, as to the results to be obtained therefrom and, to the maximum extent allowed by law, it shall not have any liability or responsibility for injury or damages arising in connection therewith. Copyright ©2025, S&P Global Market Intelligence (and its affiliates, as applicable). Indices referenced are unmanaged and cannot be invested in directly. Index returns do not reflect any investment management fees or transaction expenses. All commentary contained within is the opinion of Prime Buchholz and is intended for informational purposes only; it does not constitute an offer, nor does it invite anyone to make an offer, to buy or sell securities. The content of this report is current as of the date indicated and is subject to change without notice. It does not take into account the specific investment objectives, financial situations, or needs of individual or institutional investors. Some statements in this report that are not historical facts are forward-looking statements based on current expectations of future events and are subject to risks and uncertainties that could cause actual results to differ materially from those expressed or implied by such statements. Information obtained from third-party sources is believed to be reliable; however, the accuracy of the data is not guaranteed and may not have been independently verified. Performance returns are provided by third-party data sources. Past performance is not an indication of future results. © 2025 Prime Buchholz LLC