At the Jackson Hole Symposium last month, Federal Reserve Chair Jerome Powell confirmed what markets have been expecting for some time: Rate cuts are set to begin on September 18th. The size of the cut—whether it will be 25 or 50 bps—will depend on incoming data.
Prior to the next Fed meeting, one more nonfarm payroll report will be released and analyzed, as will another inflation report and other key indicators. These metrics will play a pivotal role in determining the size of the rate cut and could significantly impact current market dynamics.
In this investment perspective, we explore the current economic environment, compare the Fed’s reaction to the expectations of the broad market versus market expectations on the path of rates, and offer strategies for fixed income implementation in this evolving landscape.
Current Conditions
In recent weeks, there have been signs that the economy is slowing and that labor markets are normalizing; however, recessionary pressures are not evident. The Fed has made “non-recessionary rate cuts” in the past (1984, 1987, 1998, 2019), but the majority stemmed from exogenous shocks like Black Monday (1987), the Asian Financial Crisis (1998), and tense trade situations (2019).
The Fed has been striving to achieve the ever-allusive “soft landing”—loosely defined as decreasing inflation through rate hikes without drastically increasing unemployment or causing GDP growth to turn negative. However, over the past four cycles, recessions occurred after the Fed began reducing rates. While the Fed may be successful this time around, history suggest the odds could be long.
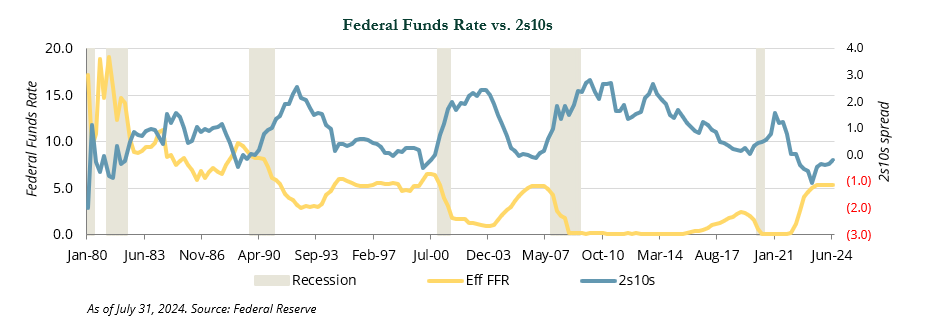
Another unusual dynamic is the shape of the yield curve. The yield curve has been inverted—meaning the yield on the 2-year Treasury is greater than that
of the 10-year Treasury (the “2s10s”)— since July 7, 2022. It recently surpassed 624 days, which was the longest previous period of inversion, set in 1978.
Historically, the yield curve moves from being inverted to positively sloped as markets begin to price in an easing cycle. While the curve has steepened, it remains modestly inverted. The 2s10s spread was −106 bps in June 2023, and as of September 3rd it was −3 bps.
How and when the curve eventually un-inverts will impact fixed income returns. Since April 2024, the decline of the 2-year yield has exceeded the decline of the 10-year yield, which we believe is preferable compared to the normalization that would occur from declining 2-year yields and rising 10-year yields. Whether this trend continues remains to be seen as deficits are expected to continue and will need to be financed through Treasury issuance.
It is important to consider that we are in an election year and neither party is campaigning for fiscal restraint. Therefore, deficits will remain in place and need to be financed. Given the large amount of Treasury bill issuance that has occurred since the resolution of the debt ceiling crisis in May 2023, the Treasury Department may have to rely on more coupon issuance to fund deficits. This could potentially cause the long end of the curve to steepen.

Projections & Economic Signals
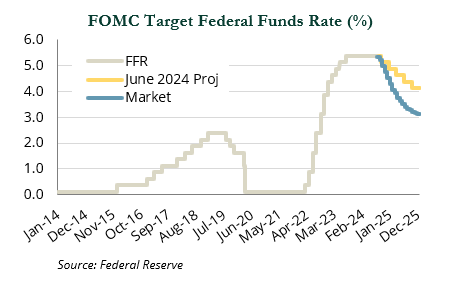
In its June 2024 Summary of Economic Projections (SEP), which is published each quarter, the Fed predicted one 25 bps rate cut in 2024 and four 25 bps cuts in 2025. As of August 26th, futures contracts for the federal funds rate (FFR) showed that the market believes the Fed will cut rates three times in 2024 and predicted the FFR will be 3.1% by December 2025—implying nine 25 bps cuts from August 2024 to December 2025.

Over the past few years, the Fed has consistently adjusted its rate outlook higher as inflation remained stubbornly elevated. It is possible the Fed will revise its expectations for the path of rates when it releases its next SEP on September 18th.
Similarly, the market has shown dramatic shifts in its expectations based on economic data. At the start of 2024, the market projected up to seven rate cuts, only to temper its view when inflation ran hotter than anticipated earlier this year.
Currently, there is a meaningful divergence between the Fed’s views and those of the market. However, these perspectives can change quickly. The key takeaway is that the Fed appears ready to lower rates as inflationary pressure has eased, allowing it to focus more on the second—but equally important—part of its dual mandate: promoting maximum employment.
Fixed Income Implementation
We analyzed the performance of fixed income and other asset classes over the past six easing cycles to gauge how capital markets might respond. The table below shows that fixed income, particularly Treasuries, have historically performed well just before and during an easing cycle.
We believe that Treasuries may be a more effective hedge compared to the Bloomberg U.S. Aggregate Index, which could experience spread widening in the corporates and mortgage-backed debt subsectors. Of all the sectors, cash will likely face the most significant reinvestment risk; during easing cycles, it has typically lagged its longer-duration counterparts.
While we recognize that the conditions leading to the easing cycles differ from the starting conditions today, it is important to note that yields will reprice lower when rate cuts begin. Historically, fixed income has performed well in this environment.
We also observe that while the largest returns have typically been found in very long-dated fixed income, there has been a meaningful benefit along the intermediate part of the curve as well.
Conclusion
As the Fed’s easing cycle is set to begin, historical patterns suggest that fixed income—especially in the intermediate to long-term segments—has the potential to enhance returns and reduce drawdown risks, positioning portfolios to capitalize on the favorable conditions typically associated with rate cuts.
While the depth of the easing cycle remains uncertain, barring any unforeseen exogenous events, we do not believe a zero lower bound is the Fed’s ultimate destination. However, any reduction in rates is likely to benefit fixed income investors.
Given this outlook, we recommend clients consider extending duration in their portfolios as the upcoming easing cycle should offer opportunities to capitalize on favorable conditions typically associated with rate cuts.
Please reach out to your investment team with any questions. ■
Indices referenced are unmanaged and cannot be invested in directly. Index returns do not reflect any investment management fees or transaction expenses. Bloomberg Index Services Limited. BLOOMBERG® is a trademark and service mark of Bloomberg Finance L.P. and its affiliates (collectively “Bloomberg”). Bloomberg or Bloomberg’s licensors own all proprietary rights in the Bloomberg Indices. Bloomberg does not approve or endorse this material, or guarantee the accuracy or completeness of any information herein, or make any warranty, express or implied, as to the results to be obtained therefrom and, to the maximum extent allowed by law, it shall not have any liability or responsibility for injury or damages arising in connection therewith. Copyright MSCI 2024. Unpublished. All Rights Reserved. This information may only be used for your internal use, may not be reproduced or redisseminated in any form and may not be used to create any financial instruments or products or any indices. This information is provided on an “as is” basis and the user of this information assumes the entire risk of any use it may make or permit to be made of this information. Neither MSCI, any of its affiliates or any other person involved in or related to compiling, computing or creating this information makes any express or implied warranties or representations with respect to such information or the results to be obtained by the use thereof, and MSCI, its affiliates and each such other person hereby expressly disclaim all warranties (including, without limitation, all warranties of originality, accuracy, completeness, timeliness, non-infringement, merchantability and fitness for a particular purpose) with respect to this information. Without limiting any of the foregoing, in no event shall MSCI, any of its affiliates or any other person involved in or related to compiling, computing or creating this information have any liability for any direct, indirect, special, incidental, punitive, consequential or any other damages (including, without limitation, lost profits) even if notified of, or if it might otherwise have anticipated, the possibility of such damages. FTSE International Limited (“FTSE”) © FTSE 2024. FTSE® is a trademark of the London Stock Exchange Group companies and is used by FTSE under license. All rights in the FTSE indices and / or FTSE ratings vest in FTSE and/or its licensors. Neither FTSE nor its licensors accept any liability for any errors or omissions in the FTSE indices and / or FTSE ratings or underlying data. No further distribution of FTSE Data is permitted without FTSE’s express written consent. All commentary contained within is the opinion of Prime Buchholz and is intended for informational purposes only; it does not constitute an offer, nor does it invite anyone to make an offer, to buy or sell securities. The content of this report is current as of the date indicated and is subject to change without notice. It does not take into account the specific investment objectives, financial situations, or needs of individual or institutional investors. Information obtained from third-party sources is believed to be reliable; however, the accuracy of the data is not guaranteed and may not have been independently verified. Performance returns are provided by third-party data sources. Past performance is not an indication of future results. © 2024 Prime Buchholz LLC

