Global markets experienced sharp selloffs from August 1st to August 5th. We saw mid-single-digit declines in equity markets with notable weakness in Japan and in U.S. small caps, which fell 18.2% and 8.8%, respectively. Even the mighty “Magnificent 7” were weak, leading to a 7.3% decline in the information technology sector. As a result of the large decline, the VIX spiked above 60—the third largest move in its history (behind October 2008 and March 2020).
Several factors contributed to this shift in sentiment. The Federal Reserve decided to maintain current interest rates at its meeting on July 31st. Subsequent labor reports, including weekly unemployment claims and unexpected weakness in the July nonfarm payroll report on August 1st, raised concerns that the Fed might be lagging in its response.
The Bank of Japan’s rate hike led to a significant spike in the yen, further exacerbating those fears. Warren Buffet’s announcement that he had halved his stake in Apple and was holding a significant cash position ignited those concerns further. This all contributed to Monday, August 5th being the worst day for the Dow Jones Industrial Average since the COVID-19 pandemic.
On Tuesday, there were signs of market recovery. The Nikkei Index surged by 10%, and U.S. equity markets also showed signs of rallying. However, the recovery has not yet completely offset the losses incurred over the past week. Barring any surprises, we expect markets to remain on edge and volatile until conditions stabilize.
In this report, we will look at some main areas of market weakness to provide some context to the turbulent start to August.
1. Yen Carry Trade Unwinds
The recent spate of volatility in Japanese and U.S. equities brought to light the role the Japanese yen carry trade has been playing in global markets. A carry trade is generally structured as follows:
- Borrow money in a stable, low interest rate market (Japan)
- Convert assets to local currency (U.S. dollar)
- Invest in higher returning assets (U.S. debt, equities, etc.)
Investors have been taking advantage of the prolonged zero interest rate environment in Japan and the weak yen to increase the amount of capital borrowed. However, the Bank of Japan (BOJ) raised its core interest rate from 0% to 0.25% at the end of July, citing inflation concerns and a weak yen. The BOJ also indicated more rate hikes may occur in the near future.
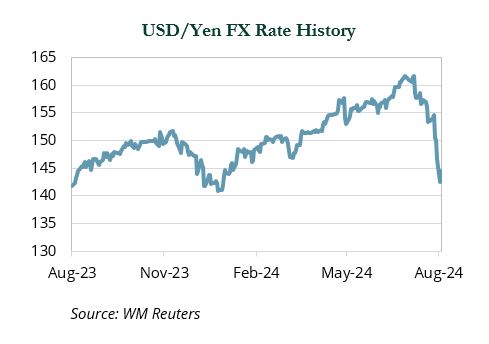
The yen began July trading at its weakest level against the USD in nearly 40 years. However, the yen rapidly appreciated in recent weeks, presenting a new challenge for investors engaged in the carry trade. At the same time, weak tech earnings in the U.S. and concerns about an economic slowdown following a disappointing labor report led to weakness in equity markets.

This abrupt shift on both sides of the carry trade likely triggered margin calls, causing investors to quickly unwind positions and intensifying the equity market sell-off. Although the USD/yen exchange rate is essentially flat year-to-date (YTD), a 10% decline in a typically stable currency in a matter of weeks was enough to destabilize markets.
While it is challenging to determine the exact amount of capital involved in the yen carry trade, the recent surge in volatility in Japanese assets suggests it may have been more substantial than previously anticipated.
2. Equity Market Volatility Returns
The recent spike in volatility marked the end of an unusually quiet period in the markets. The S&P 500 experienced a streak of 356 trading days without a 2% drawdown, which ended on July 24th. According to JPMorgan, the S&P 500 had intra-year drops averaging 14%; it registered a drawdown of 10% in 2023 and 5% YTD through July 2024.
From its recent high on July 16th, the S&P 500 declined by 8.5% through the close of the market on August 5th, approaching correction territory based on market lows earlier in the day. The majority of this decline occurred over the first three trading days of August, during which the index fell by 6.5%.
The recent decline has been driven by several factors, notably investor concerns that the Fed has been slow to aggressively cut interest rates to prevent a recession. These fears were exacerbated by a worse-than-expected jobs report released on Friday, which highlighted a jump in the unemployment rate to 4.3%.
That same day, underwhelming earnings from Amazon and Intel led to sizable stock declines for both companies, adding to recent concerns about AI-related stocks following significant gains since the end of 2022.
The tech-dominated NASDAQ 100 Index entered correction territory on Monday, closing the day more than 13% below its recent July 11th peak. NVIDIA, which briefly became the largest company in the world by market cap due to its AI prospects, closed Monday nearly 30% off its all-time high and down over 14% during the first three trading days due to concerns about revenue prospects for AI and news of a production delay for its next-generation chips. Amazon (−13.9%) and Tesla (−14.3%) also posted double-digit losses over the three days.
Among other “Magnificent 7” holdings, Apple’s (−5.8%) decline coincided with Berkshire Hathaway announcing it sold more than half its shares in the stock in the second quarter. Amid extremely weak sentiment, an antitrust ruling against Google’s search engine contributed to a drop in Alphabet (−7.2%) and while there was no company-specific news relating to Microsoft (−5.5%), it traded down in sympathy with its peers.
The Russell 2000 Index, which rallied sharply in July relative to large-cap stocks, has not been immune to recent market weakness. The small cap benchmark was down 9.6% during the first three days of August, returning to levels seen at the start of the quarter.
3. Oil Prices Jump
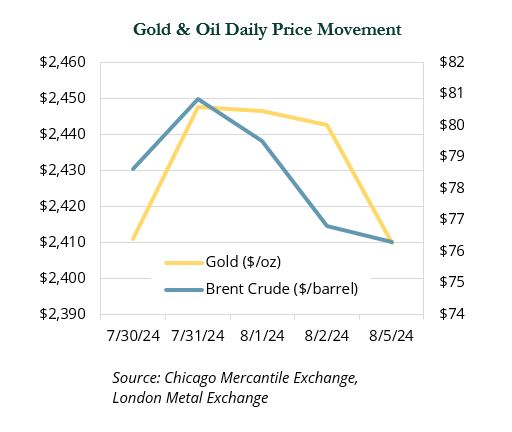
Oil prices experienced significant volatility over the past few days. Brent Crude prices rose by 2.8% on July 31st following the killing of Hamas leader Ismail Haniyeh in Iran and concerns about escalating conflict in the Middle East. However, the 5.6% price decline month-to-date as of August 5th was primarily due to weak economic data in the U.S. and declining market sentiment the first two days of August.
Similarly, gold prices advanced by 0.9% on July 31st due to increased geopolitical concerns. However, they remained steady during the economic weakness on August 1st and 2nd, before selling off during the market-wide decline on August 5th.
Defensive and longer-duration real asset categories generally performed better than broad market equities. Global real estate and global infrastructure saw declines of 2.4% and 2.5% MTD as of August 5th, respectively. Meanwhile, Bitcoin experienced a significant decline, down 18.1% MTD, with the largest drawdown occurring during the market selloff on Monday.

Conclusion
Periods of extreme volatility can be unsettling for investors. Market value declines raise concerns about meeting spending goals for nonprofits, benefit payments for pensions, and payroll for operating portfolios.
There are silver linings from the past week. Valuations (from P/E ratios to credit spreads), which continue to be rich compared to long-term averages, have become more attractive on the margin. Lastly, despite this period of weakness, the S&P 500 is still up nearly 11% on a YTD basis ending August 6th.
Behavioral finance shows that people often make poor decisions under stress; herd behavior often leads investors to settle into extremes of eliminating risk during selloffs or piling on risk during rallies—neither of which are advisable.
It is important to appreciate the protection offered by diversified portfolios during this period of volatility, even if it is not immediately apparent. We are mindful of the risks facing investors, including the heavy election year and heightened geopolitical tensions.
We believe the events of the past week offer investors an opportunity to rebalance portfolios to take advantage of market weakness and recommend that clients stay the course and keep their long-term objectives in mind.
We understand the current state of discomfort and encourage you to reach out with any questions. ⬛
Indices referenced are unmanaged and cannot be invested in directly. Index returns do not reflect any investment management fees or transaction expenses. All commentary contained within is the opinion of Prime Buchholz and is intended for informational purposes only; it does not constitute an offer, nor does it invite anyone to make an offer, to buy or sell securities. The content of this report is current as of the date indicated and is subject to change without notice. It does not take into account the specific investment objectives, financial situations, or needs of individual or institutional investors. Information obtained from third-party sources is believed to be reliable; however, the accuracy of the data is not guaranteed and may not have been independently verified. Performance returns are provided by third-party data sources. Past performance is not an indication of future results. © 2024 Prime Buchholz LLC

