Fiscal Year 2024 proved to be a strong year, with double-digit gains of approximately 10% for a diversified portfolio, building off of gains of more than 11% in the previous fiscal year.
Like the previous period,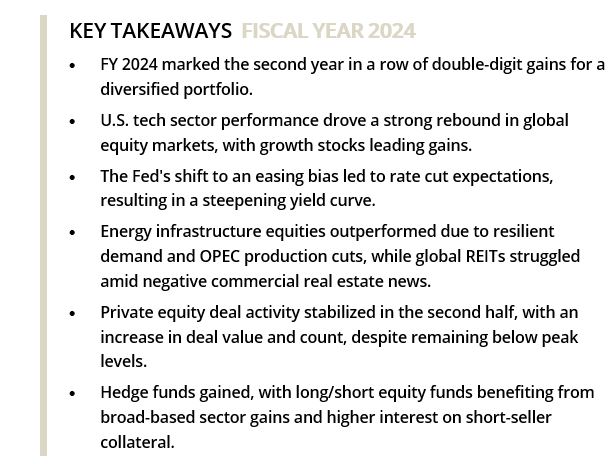 global equities experienced a robust rally in FY 2024 and were the main driver of returns. This was notable given a challenging start due to inflation worries. Markets rebounded as inflation eased and the Fed’s stance became less aggressive. The S&P 500 and Russell 3000 posted impressive gains, driven by the “Magnificent 7.” Mega cap tech outperformance boosted growth over value and large caps over small caps. Sector-wise, communications services and IT were top performers, while real estate lagged.
The Fed shifted from a hawkish stance to an easing bias, guiding for rate cuts in 2024. Despite initial higher inflation reports, the yield curve steepened, with front-end yields anchored near the federal funds rate and long-end yields rising. Treasury bills performed best, while long-term Treasuries declined. Credit spreads narrowed, with high yield and leveraged loans outperforming investment-grade corporates.
Real assets had mixed performance. Energy infrastructure equities and resource equities outperformed, due to resilient demand and production cuts, while global REITs underperformed amid negative commercial real estate headlines. Infrastructure equities gained, supported by strong power demand, while clean energy equities fell sharply due to oversupply concerns and reduced rate cut expectations. Political events globally are expected to continue contributing to market volatility.
Global Equities
Equity markets continued their strong rally in FY 2024. The S&P 500, a proxy for U.S. equities, gained 24.6%, while the broader Russell 3000 Index gained 23.1%. The fiscal year got off to a tough start, with three consecutive months of equity declines from August through October, which tipped the market into a correction. Investors were concerned that persistent inflation would increase interest rates and result in a hard economic landing.
However, boosted by a rebound in corporate earnings, investor sentiment shifted sharply as inflation began to subside and the Fed’s signaling turned less hawkish. Equities staged a strong rally, with the S&P 500 reaching all-time highs in January. By the end of June, the Index had registered 31 all-time highs.
Mega cap tech stocks continued to drive performance throughout the fiscal year. The six largest stocks—Apple, Microsoft, NVIDIA, Alphabet, Amazon, and Meta—contributed over 50% of the gain for the S&P 500. NVIDIA’s staggering 192.1% gain for FY 2024 contributed roughly 520 bps to index performance.
The mega cap tech outperformance lifted growth stocks over their value counterparts and large caps over small caps. Over the full year, the Russell 3000 Growth Index gained 32.2%, versus 12.9% for the Russell 3000 Value Index, while the Russell 2000 Index gained 10.1%, versus a 23.9% advance for the Russell 1000 Index. Helped by mega cap tech names, communications services (+42.0%) and IT (+39.1%) were the best performing sectors for the year, while the defensive real estate sector (+4.9%) was the worst performer.
Developed non-U.S. equities (+11.5%) performed well, but lacked the tech exposure that drove domestic returns. Japan was a standout (+25.9% in local terms). Investors embraced improvements in corporate governance and a return to more orthodox policy, driving the Nikkei 225 to fresh all-time highs during the fiscal year. Weakness in the yen (−10.1% vs. the USD) proved a double-edged sword, as it made the country’s exports more competitive, but hampered returns for U.S. based investors.
Returns across Europe (+11.7%) were favorable over much of the fiscal year, but limped to the close amidst political uncertainty. EU parliamentary elections saw rising support for the far-right, which led President Macron to call snap elections in France (+0.5% FY, −7.5% in June) in an effort to slow far-right (National Rally party) momentum. The gambit paid off in that it kept the National Rally party at bay. However, while the left-wing alliance won the most seats, it fell short of an absolute majority, leaving France with a hung parliament and an inherently unstable situation in an anchor EU country.
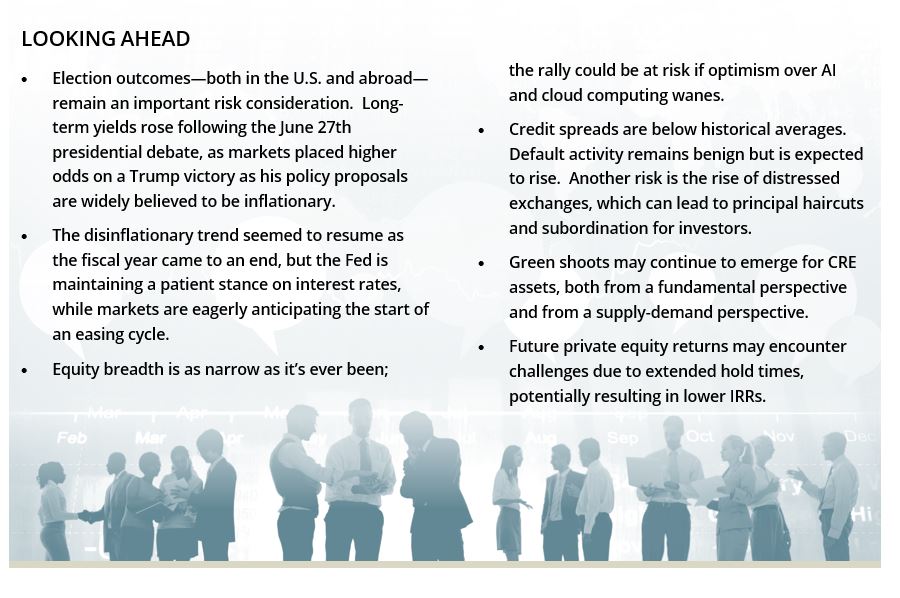
With half the world’s population heading to the polls in 2024, politics will continue to serve as a source of volatility for markets around the globe.
Emerging markets equities gained 12.5% in the fiscal year ended June 2024. While uncertainty within China (−1.6%) continued to pressure the asset class throughout the year, performance dispersion by country was wide, with several notable areas of strength. China entered the fiscal year with a bleak outlook, as its economy struggled to recover from a COVID-related slowdown in growth and continued turmoil in the property sector.
While uncertainty remains, particularly ahead of the U.S. election, positive momentum picked up in the latter half of the year on incremental policy support and better than expected growth in the first quarter of 2024.
The tech-heavy market of Taiwan (+40.7%) buoyed emerging markets higher on the back of AI-related demand for hardware and inputs such as logic and memory chips. India (+34.4%) remained a bright spot, driven by positive structural growth trends. Indian equities were briefly rattled in April, when Prime Minister Narendra Modi secured an historic third term, but his Bharatiya Janata party unexpectedly failed to secure a majority, promoting concerns that Modi’s economic agenda could now be compromised by having to rely on coalition parties.
Fixed Income
The Fed changed course in the early days of the 2024 fiscal year, concluding the sharpest tightening cycle in a generation. On July 27, 2023, the Federal Open Market Committee raised the federal funds rate by 25 bps to a range of 5.25–5.50%. While it did have one additional rate hike penciled in for the remainder of 2023 and maintained a hawkish stance, the Fed eventually pivoted at its December meeting and shifted to an easing bias. Although it guided for roughly three rate cuts for calendar year 2024, markets exuberantly priced in up to seven rate cuts, with the first coming in June 2024—the end of the fiscal year.
Markets proved to be overly optimistic about rate cuts as the inflation reports released during the last quarter of the fiscal year came in higher than expected. Interest rate volatility rose meaningfully, as markets reassessed the prospects of rate cuts.
However, the disinflationary trend did resume in the latter months of the year. The combination of tamer inflation reports, along with the Fed announcing that it would soon start to slow the runoff of its balance sheet, had a dampening effect on rate volatility and led to a bond market rally as the fiscal year ended.
Over the course of FY 2024, the yield curve underwent a dramatic steepening. Yields at the front-end remained anchored near the federal funds rate, while those at the long-end rose meaningfully. These shifts caused the curve between 2-year and 10-year Treasuries (2s10s) to steepen 71 bps, while the curve between the 5-year and 30-year Treasuries (5s30s) steepened 48 bps. As a result, Treasury bills (+5.5%) were the best performing part of the Treasury market, followed by those in the 1-3 year maturity range (+4.5%). Intermediate-term Treasuries rose 1.6% and long-term Treasuries declined 5.6%.
Credit spreads narrowed during FY 2024. High yield declined the most, dropping 81 bps to 309 bps over comparable Treasuries. The 37 bps decline in commercial mortgage-backed securities (MBS) was noteworthy, given ongoing concerns with office space vacancies and struggling retailers. With spreads tightening, credit outperformed Treasuries. High yield bonds and leveraged loans rose 10.4% and 10.8%, respectively, over the last year, outpacing the 4.6% gain in investment-grade corporates. Within the securitized space, commercial MBS (+5.8%) and asset-backed securities (+5.5%) outpaced MBS (+2.1%), which was held in check by rising long rates.
Real Assets
Real assets delivered mixed performance. Resource equities (+17.0%) and energy infrastructure equities (+35.8%) once again outperformed, as OPEC maintained production cuts and global demand for natural gas, oil, and other petroleum products proved resilient. Spot prices for WTI crude oil increased 20.7%, to finish at $81.7 per barrel, which helped deliver strong profits for producers and other companies up and down the energy value chain.
Private equity energy funds continued to capitalize on the consolidation wave in the energy sector by selling portfolio companies to larger public firms seeking to replenish their inventory of assets in basins like the Permian. U.S. oil and gas deals hit a record $51 billion during the third quarter of fiscal year 2024, according to Enverus.
Global REITs underperformed, managing a 4.5% return for the fiscal year. REITs produced strong returns in the first half of the fiscal year (+8.6%), as expectations for multiple near-term rate cuts grew, but then retreated 3.7% in the second half, as rate cut expectations were pared and negative headlines around commercial real estate (CRE) continued. Headlines highlighted stressed and distressed assets, portfolios, and balance sheets. While the office sector was the primary source of underlying distress, the multi-family sector also contributed, as many assets were bought at peak pricing and levered up with floating rate debt.
Historically, downturns in CRE have created a target rich opportunity set, producing some of the best entry points for both private real estate vintages and REITs. Recent positive indicators include a 170% increase in CMBS issuance year-over-year as of March 31, 2024.
There have been some recent data points indicating green shoots for the sector. Also, planned new supply is down sharply across many sectors, which combined with resilient space demand could bode well for fundamentals in 2025 and 2026.
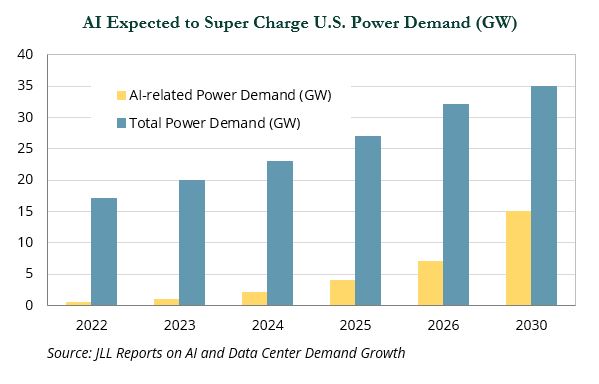
Infrastructure equities (+7.0%) moved higher despite more tepid rate cut expectations. The midstream energy sector buoyed returns and strong tailwinds across the power generation, energy transition, utility, and digital sectors continued to benefit the asset class. Growth in power demand is being driven by the electrification of vehicle fleets, the decarbonization of existing sources of energy, increased manufacturing activity, and the explosive growth in AI—which is expected to increase power demand for data centers.
Clean energy equities fell sharply (−25.7%) on pared back interest rate cut expectations, oversupply of solar components principally from China, and concern that a change in administration in the U.S. could result in less federal support for the sector. The public clean energy universe includes a mix of renewable utilities, solar component manufacturers and suppliers, wind equipment and construction firms, and venture-like technology companies.
Private Equity
Private equity deal activity showed signs of stabilizing in the second half of FY 2024 after a challenging calendar year 2023. In the first half of FY 2024 (July 2023 to December 2023), private equity deal activity struggled to reset—most notably over the October to December timeframe, with deal value falling 22.6% compared to the same three-month period the previous year. As a result, calendar year 2023 showed the lowest deal value since its 2017 low point.
As the second half of FY 2024 commenced, the market began to show signs of life. Large deals made a comeback and add-on acquisitions helped fill some of the void left by fewer platform deals. During the last quarter of FY 2024, deal count climbed to the highest level since mid-2022.
While deal activity improved in the second half, fundraising timelines continued to lengthen, with the median time to close reaching 18.1 months in the second half of FY 2024—up from 14.1 months in calendar year 2023. Exit activity showed some encouraging signs in late FY 2024 after a difficult 2022-2023 period. Exit value increased roughly 15% year-over-year in the second half FY 2024, though exit count remained flat.
Venture capital dealmaking in the second half of FY 2024 climbed to the highest level since mid-2022, while deal value reached an eight-quarter high. However, it is worth noting that a few sizeable deals, particularly in the AI space, skewed the overall numbers.
Flexible Capital
Hedge funds, as measured by the HFRI Fund Weighted Composite Index, rose 9.8% for FY 2024. Long/short equity outpaced the overall benchmark, with the HFRI Equity Hedge Index up 12.0%, driven primarily by the long portions of portfolios. Directional equity and credit strategies outperformed relative value and macro amid a continued bid for risk assets. Despite the sharp rallies in the tech sector, gains among the long portfolios were broad-based across many sectors.
Nearly 88% of Goldman Sachs VIP stocks—the top 50 most widely held long positions by hedge funds that use Goldman Sachs as a prime broker—generated positive returns during the FY 2024. For example, financial firms with large private equity and credit arms such as KKR and Apollo saw their stocks rally 89.6% and 56.6%, respectively, while in healthcare, Eli Lilly surged over 90%. In industrials, GE Aerospace and Transdigm were grew 82.2% and 48.1%, respectively.
Following these gains, hedge funds have reduced overall risk exposures, particularly within the tech sector. The elevated interest rate environment provided another tailwind for long/short equity funds. Higher yields on cash and short-term fixed income results in higher interest on short-seller collateral (short rebate), which may boost performance for short book returns.
To a lesser extent, credit and event-driven manager performance was also positive, with the HFRI Event Driven Index and the HFRI Event Driven: Distressed/ Restructuring Index each rising 10.6%. The majority of these managers generated positive performance, with event-driven equity strategies achieving slighly higher returns than the credit-oriented managers.
Credit spreads contracted tighter over FY 2024 and defaults remained low. However, signs of stress formed in the rate-sensitive leveraged loan market and creditors engaged in increasingly more aggressive tactics to protect their claims. While the lack of bankruptcies limited the opportunity set for traditional distressed managers, many have rotated into performing credit where yields are attractive and company-specific catalysts can unlock upside.
Merger & acquisiton activity increased slightly off of lows in 2023, but deal activity remained soft. Companies may have delayed action due to uncertainity in the macro backdrop, which could result in more activity over the next 12 months.
Private credit continued to see robust investor demand, and large asset managers continued to benefit from the stable fees and the illiquid nature of the asset class. Fundraising in the upper middle-market continued vigorously, leading to increased competition for loans with many private lenders now contending with multinational banks and public markets. The lower middle market remained less competitive and generally offers better creditor protections. ⬛
Copyright MSCI 2024. Unpublished. All Rights Reserved. This information may only be used for your internal use, may not be reproduced or redisseminated in any form and may not be used to create any financial instruments or products or any indices. This information is provided on an “as is” basis and the user of this information assumes the entire risk of any use it may make or permit to be made of this information. Neither MSCI, any of its affiliates or any other person involved in or related to compiling, computing or creating this information makes any express or implied warranties or representations with respect to such information or the results to be obtained by the use thereof, and MSCI, its affiliates and each such other person hereby expressly disclaim all warranties (including, without limitation, all warranties of originality, accuracy, completeness, timeliness, non-infringement, merchantability and fitness for a particular purpose) with respect to this information. Without limiting any of the foregoing, in no event shall MSCI, any of its affiliates or any other person involved in or related to compiling, computing or creating this information have any liability for any direct, indirect, special, incidental, punitive, consequential or any other damages (including, without limitation, lost profits) even if notified of, or if it might otherwise have anticipated, the possibility of such damages. Bloomberg Index Services Limited. BLOOMBERG® is a trademark and service mark of Bloomberg Finance L.P. and its affiliates (collectively “Bloomberg”). Bloomberg or Bloomberg’s licensors own all proprietary rights in the Bloomberg Indices. Bloomberg does not approve or endorse this material, or guarantee the accuracy or completeness of any information herein, or make any warranty, express or implied, as to the results to be obtained therefrom and, to the maximum extent allowed by law, it shall not have any liability or responsibility for injury or damages arising in connection therewith. Copyright ©2024, S&P Global Market Intelligence (and its affiliates, as applicable). Reproduction of any information, data or material, including ratings (“Content”) in any form is prohibited except with the prior written permission of the relevant party. Such party, its affiliates and suppliers (“Content Providers”) do not guarantee the accuracy, adequacy, completeness, timeliness or availability of any Content and are not responsible for any errors or omissions (negligent or otherwise), regardless of the cause, or for the results obtained from the use of such Content. In no event shall Content Providers be liable for any damages, costs, expenses, legal fees, or losses (including lost income or lost profit and opportunity costs) in connection with any use of the Content. A reference to a particular investment or security, a rating or any observation concerning an investment that is part of the Content is not a recommendation to buy, sell or hold such investment or security, does not address the suitability of an investment or security and should not be relied on as investment advice. Credit ratings are statements of opinions and are not statements of fact. FTSE International Limited (“FTSE”) © FTSE 2023. FTSE® is a trade mark of the London Stock Exchange Group companies and is used by FTSE under license. All rights in the FTSE indices and / or FTSE ratings vest in FTSE and/or its licensors. Neither FTSE nor its licensors accept any liability for any errors or omissions in the FTSE indices and / or FTSE ratings or underlying data. No further distribution of FTSE Data is permitted without FTSE’s express written consent. Indices referenced are unmanaged and cannot be invested in directly. All commentary contained within is the opinion of Prime Buchholz and is intended for informational purposes only; it does not constitute an offer, nor does it invite anyone to make an offer, to buy or sell securities. The content of this report is current as of the date indicated and is subject to change without notice. It does not take into account the specific investment objectives, financial situations, or needs of individual or institutional investors. Some statements in this report that are not historical facts are forward-looking statements based on current expectations of future events and are subject to risks and uncertainties that could cause actual results to differ materially from those expressed or implied by such statements. Information obtained from third-party sources is believed to be reliable; however, the accuracy of the data is not guaranteed and may not have been independently verified. Performance returns are provided by third-party data sources.
Past performance is not an indication of future results.