Market Updates, Perspectives
Investment Perspective: A Return to Irrational Exuberance?
Feb 21, 2024
Back to all posts.What a difference a few months make.
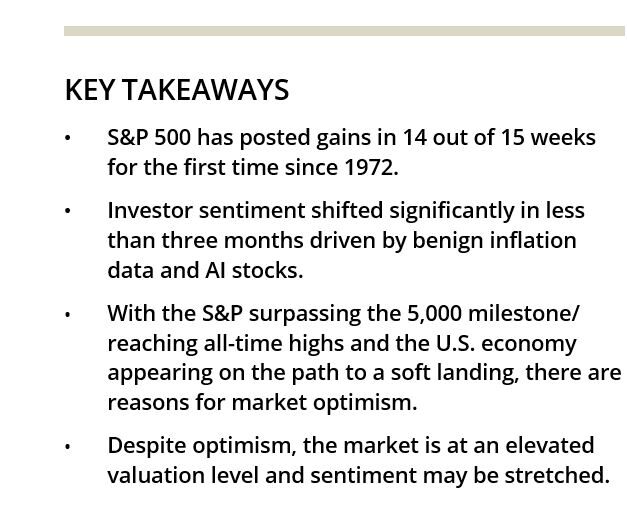
 Through mid-February, the S&P 500 rallied over 20% off its late-October 2023 lows. Following a two-year break, the Index reached all-time highs in January 2024 and crossed the 5,000 milestone in early February. Performance has been very consistent, with the S&P posting gains in 14 out of 15 weeks—a streak last seen in 1972.
As the Wall Street saying goes: nothing changes sentiment like price. In less than three months, the bearish sentiment expressed in the AAII Investor Sentiment Survey shifted from two standard deviations above the historical average to one standard deviation below. Similarly, a Bank of America survey of global fund managers revealed the highest allocation to U.S. stocks since November 2021.
Two narratives drove the market movement in recent months: (1) Relatively benign inflation data combined with Fed guidance convinced investors that no additional interest rate hikes were expected, even if cuts come later than originally anticipated and (2) the rapid development of the artificial intelligence (AI) technology pushed up AI-adjacent stocks to dizzying heights.
NVIDIA, the leader in AI computing, was the single largest contributor to S&P 500 performance year-to-date through February 15th, accounting for over a quarter of the gains. The stock surged more than 45% in the span of six weeks, adding over $500 billion to its market cap. During that time, NVIDIA surpassed Amazon and Alphabet to become the third largest stock by market cap behind only Microsoft and Apple.
Further down the capitalization spectrum, server manufacturer Super Micro Computer (SMCI) posted even stronger gains, soaring over 250% YTD through February 15th. SMCI became by far the largest stock in the Russell 2000 Index in February, and accounted for over three quarters of the benchmark’s YTD gains as of February 15th.
Narratives that drive rapid, outsized gains are nothing new. Three years ago, we saw similar dynamics in the electric vehicle (EV) space, where Tesla was a significant contributor amongst large caps and Plug Power amongst small caps. While EV technology continues to develop rapidly, both companies currently trade well below their peaks in 2021 as investor sentiment subsided over time.
From a factor standpoint, outside of a handful of AI names, the February market leaders are a group of stocks with similar attributes to stocks that led other frothy rallies in the past four years: heavily shorted names, retail trader favorites, and/or crypto stocks.
As of February 15th, hedge funds were the most net long they had been over the last year, but were still below peak levels of the last three to five years. A Goldman Sachs survey of institutional investors in early February also indicated that sentiment was exceptionally high.
While additional buying power remains, the rally feels fragile.
In the aftermath of the recent gains, the S&P 500 was trading at a 20.4x forward multiple—the highest valuation level in over two years. On average, the index traded at a 17.7x multiple the past 10 years, leaving room for multiple contraction should investor sentiment reverse.
Given the recent dominance of mega-cap tech stocks, the S&P 500 has also been trading close to a multi-year high multiple premium to the equal-weighted version of the index (20.4x vs.16.3x). Historically, the spread between the cap-weighted and equal-weighted versions of the Index was 1.2x multiple points.
Based on the S&P surpassing the 5,000 milestone and reaching all-time highs, inflation subsiding, and the U.S. economy appearing on the path to a soft landing, there are reasons to be optimistic about the market outlook. However, investor sentiment appears to be stretched and a shakeout of speculative pockets could occur. We also note that the potential risks posed by geopolitical instability and stress in commercial real estate are considerable and must be continually monitored. The recent rally could be an opportunity to trim equity exposure on strength in portfolios that are approaching the high end of their policy ranges.
Please contact your client service team with questions.
 REPORT BY ARMAN GEVORGYAN, CFA, CAIA
Principal/Director, Research – Equity
Indices referenced are unmanaged and cannot be invested in directly. Index returns do not reflect any investment management fees or transaction expenses. All commentary contained within is the opinion of Prime Buchholz and is intended for informational purposes only; it does not constitute an offer, nor does it invite anyone to make an offer, to buy or sell securities. The content of this report is current as of the date indicated and is subject to change without notice. It does not take into account the specific investment objectives, financial situations, or needs of individual or institutional investors. Some statements in this report that are not historical facts are forward-looking statements based on current expectations of future events and are subject to risks and uncertainties that could cause actual results to differ materially from those expressed or implied by such statements. Information obtained from third-party sources is believed to be reliable; however, the accuracy of the data is not guaranteed and may not have been independently verified. Performance returns are provided by third-party data sources. Past performance is not an indication of future results.© 2024 Prime Buchholz LLC