Financial markets were marked by turbulence in September due to concerns about Treasury issuance and deficits. Domestic equities fell amid fears of an economic slowdown and higher interest rates, and international markets followed suit. 
Clean energy and global real estate struggled due to negative sentiment, while some emerging markets performed well. Short sellers and distressed investors found opportunities in the interest rate environment. Meanwhile, oil prices rose due to production cuts and rising demand, while natural gas prices increased due to supply concerns.
Fixed Income
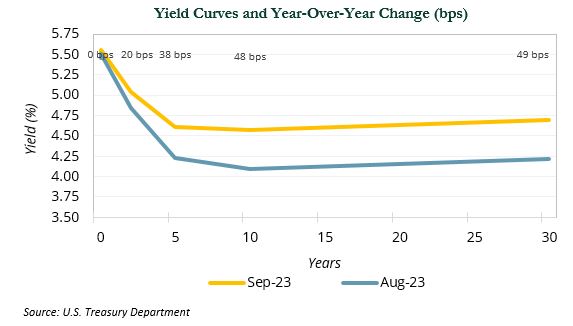
Investors grew increasingly concerned about Treasury issuance and deficit financing. Following the resolution of the debt ceiling stalemate in June, the Treasury department began a heavy issuance calendar to fill its depleted coffers and finance growing deficits, which led to a steepening of the yield curve in September.
The very front-end of the curve remained anchored as the Fed made no change to policy rates in September, but the long-end rose almost 50 bps. The chart below shows the change in the curve and highlights basis point changes along key maturity tenors.
As a result of these changes, longer-dated Treasuries fell 7.3% in September, lagging the 2.4% decline of intermediate-term Treasuries and the flat return at the front-end of the curve. Rising rates proved difficult for most areas of credit with investment-grade corporates dropping 2.7% and high yield bonds falling 1.2%. 
Securitized investments were weak as well, with declines in asset-backed securities (−0.4%), commercial mortgage-backed securities (−1.2%), and agency mortgage-backed securities (−3.2%). The only positive-returning sector in fixed income was leveraged loans (+0.8%).
Equities
Domestic equity markets sold off for the second consecutive month, as higher interest rates and concerns about an economic slowdown weighed on investors. Both the S&P 500 and the broader Russell 3000 Index declined 4.8%. Energy (+2.5%) was the lone bright spot, aided by a continued uptick in oil and gas prices.
With the recent sell-off, the S&P 500 finished September at a 17.9x forward P/E, slightly above the 10-year average (17.5x). Expectations for corporate performance remain favorable in spite of possible headwinds, such as rising consumer delinquency and turmoil in Congress. Analysts estimate that earnings growth for the Index will accelerate from 1.0% in 2023 to 11.8% in 2024.
Global equities followed a similar trajectory. The MSCI EAFE Index fell 3.4%, with continental Europe (−4.9%) performing particularly poorly. The European Central Bank hiked rates to an all-time high and also lowered growth estimates through 2025. A weaker growth outlook and expectations of stubborn inflation sparked fears of stagflation, which weighed on sentiment and markets.
Japan remained a double-edged sword as continued weakness in the yen (−2.4% vs. the USD) propelled many of its large exporters—such as Honda (+5.9%) and Toyota (+4.8%)—to all-time highs. The local Japanese market rose 0.4%, but U.S. investors suffered a loss when accounting for currency movements.
Emerging markets (−2.6% USD) were pulled down by weakness across Asia where the growth outlook continued to weaken on the back of China (−2.8% USD). Challenges within China’s property sector—historically a key component of growth—remained a headwind to economic recovery and investor confidence.
A combination of a credit crunch among property developers and consumer weakness has crippled the property market and fueled concerns about the potential impact on the broader economy. Against a backdrop of persistent uncertainty, the World Bank downgraded its growth forecast for China from 4.8% to 4.4% in April. The World Bank also downgraded its outlook for the east Asia and Pacific region due to concerns over a spillover effect from China.
While China continues to garner the most headlines, other areas of emerging markets performed well. India (+1.7%) was a bright spot boosted by the relative health of its economy and strong domestic demand. Brazil (−0.2%) was flat for the month but continues to surprise to the upside driven by better than expected growth.
Flexible Capital
Long/short equity manager performance was mixed for September as there were few places to hide on the long side of portfolios. As non-tech focused managers tend to be structurally underweight mega cap tech, down cap biases amongst hedge funds have been a steady headwind lately as large caps outperformed small and mid cap equities. However, September continued a trend from August of positive alpha across short books.
The fervor surrounding AI-related stocks that dominated markets in the spring and early summer fizzled in August and September. Hedge funds that leaned into these hot areas of the market on the short side benefited. However, despite high conviction in short themes, many managers remained wary of the potential for short squeezes and kept individual position sizes modest.
The prospect of “higher for longer” interest rates is creating fertile ground for short sellers and distressed investors as many business models are not viable in this yield environment. Lower quality companies with floating rate debt are most vulnerable to this dynamic. JP Morgan estimated a 12-month default rate of 1.9% for leveraged loans at the end of August—below long-term averages of 2.9%, but roughly double the 1% default rate in 2022. JPM indiacated it expects loan defaults to reach 4% in 2024.
Real Assets
With the exception of traditional energy, most real assets experienced negative returns in September, in line with the broader market. Brent crude rose up 6.2% and natural resource equities (+0.1%) were mostly flat. Oil prices jumped more than 25% since July after Saudi Arabia and Russia cut production by an additional 1.3 million barrels per day (MBPD). Saudi Arabia’s announced extension of the cuts through year-end 2023—pushed prices into the mid-90s. 
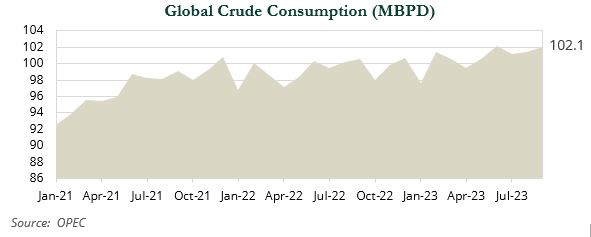
Growing global demand has played a key role in higher prices, with consumption increasing by 2 MBPD in 2023, an all-time high. To close the month, oil prices received a further boost with the American Petroleum Institute reporting crude oil inventories in Cushing, OK declined to a 14-month low. OPEC is forecasting a 3 MBPD deficit for the rest of 2023; many analysts revised their price targets higher.
Clean energy (−8.8%) had another month of poor performance, bringing YTD losses to −25.7%. The sector continues to struggle with rising negative sentiment around material and financing costs, supply chain issues, and poor earnings reports. NextEra Energy, the world’s largest clean energy company by market cap, announced a cut to its three-year growth expectations. Despite the strong sell-off YTD, medium-term returns for the sector have been significant (13.2% over five years) and medium- and long-term secular tailwinds remain in place.
Global real estate declined 6.0% with U.S. REITs falling 6.8% in the wake of rising Treasury yields. Office REITs decreased 10.7%, with increasing reports of property owners turning over their assets to banks. Despite still strong fundamentals and declining new construction starts, there is concern demand for industrial REITs (−8.5%) could soften if economic growth weakens. Apartments (−9.3%) also underperformed as debt has become more expensive and rent growth has cooled.
