Risk assets benefited investors in April despite several concerning trends, including stress in the banking sector, the risk of U.S. default due to the debt ceiling impasse, slowing GDP growth, and the increasing chance of a recession. Although the Fed’s tightening cycle is widely expected to end following one more 25 bps hike in May, the full effect of this cycle is only just beginning to be felt by households and organizations, and more defaults are expected.
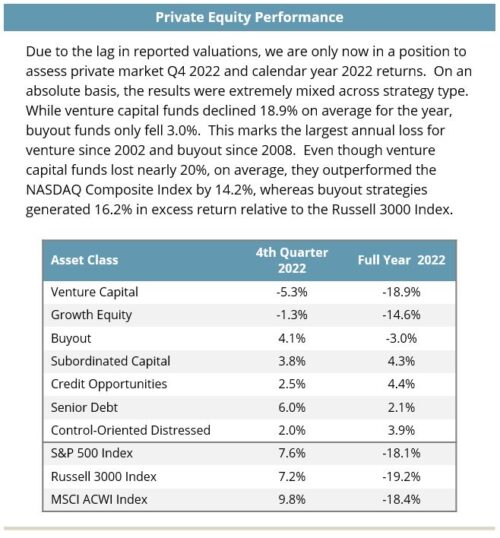
In the face of these risks, U.S. equity markets rallied as the month came to a close and finished in positive territory. U.S. equities lagged international developed equity markets (driven higher by the U.K.), but outperformed emerging markets (EM) equities (driven lower by China). Within fixed income markets, credit was positive as the impact of higher yields supported returns. However, the yield curve reflected concerns about the risk of U.S. default and the possibility of a recession. Reflecting broad-based challenges faced in the private markets and more acutely in the venture capital markets, private valuations declined, albeit modestly, in the final quarter and for the entire calendar year ended December 31, 2022. Given the lagged nature of reporting in the private markets, these valuations and losses will likely be reflected in the first quarter of 2023.
April presented the second consecutive positive month for global equity markets. The S&P 500 advanced 1.6%, while the broader Russell 3000 Index returned 1.1%. Better than expected earnings were a tailwind. With roughly half of the S&P 500 constituents having reported in April, the Index had a 79% earnings beat rate, according to FactSet. By comparison, the average earnings beat rate over the past 10 years was 73%.
FAANGM stocks posted solid gains for yet another month, with five of the six companies outpacing the broad market. With FAANGMs back in favor, large caps outpaced small caps as the Russell 1000 Index gained 1.2% versus a 1.8% decline for the Russell 2000 Index. U.S. value stocks (+1.3%) modestly outperformed their growth (+0.9%) counterparts due in part to the performance from Meta (+13.4%), which was reclassified as a value stock in 2022. However, growth remained ahead of value by over 1,200 bps year-to-date (YTD).
While developed market equities were broadly positive, international stocks (+2.8%) exceeded domestic once again in April. The MSCI EAFE Index has outpaced the S&P 500 in five of the past six months and is ahead approximately 1,200 bps for the six-month period.
Specific to April, the U.K. (+5.3%) was a standout with an improving economic and inflationary outlook. Returns across continental Europe were also strong, with all countries finishing in the green—driven largely by strength in the financials sector. Non-U.S. financials were up 3.8% for the month and 6.4% YTD despite the recent banking turmoil. Conversely, U.S. financials have fallen 1.4% YTD, reflecting risks associated with regional bank failures. International banks, particularly those in Europe, are generally less susceptible to duration mismatching due to tighter regulations and have less exposure to commercial real estate than their U.S. counterparts.
The decline in emerging markets (−1.1%) was primarily the result of weakness in China (−5.2%), where uncertainty overshadowed better than expected economic growth. After it reported GDP growth of 4.5% on a year-over year basis in the first quarter, investors grew concerned that the quick snapback in consumption would cause the government to pull back on the stimulus needed to support the economy. Investors also questioned the durability of a broader recovery in consumption amidst persistent low employment rates. Taiwan (−4.3%) was also hurt by broad weakness in the global semiconductor industry.
Fixed income markets produced positive returns in April, but for different reasons. Credit markets continued to take a sanguine view of default and recession risk, which helped investment grade and high yield corporates outpace Treasury returns. Overall investment grade corporate spreads tightened by 2 bps, but within that segment, the financial sector tightened by 7 bps, rebounding from the sector volatility experienced in March. High yield credit tightened by 3 bps to a spread level of 452 bps, which is still tighter than the long-term average of 504 bps. As a result, corporate credit—high yield, loans, investment-grade, etc.—performed in line with U.S. equity markets.
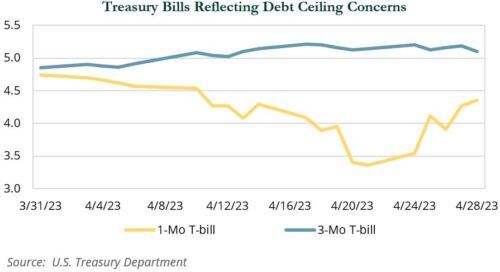
Meanwhile, yield curve shifts were pronounced at the front end of the curve, particularly between the 1-month and 3-month Treasury bill yields. The 1-month T-bill yield fell 38 bps to 4.3% while the 3-month T-bill yield increased by 32 bps to 5.1%. This divergence reflected the debt ceiling impasse in Washington, which led to investors buying near-term maturities and avoiding those deemed to be closest to the “X date”—the date when the Treasury Department will run out of cash and potentially default on its debt obligations.
Further out on the yield curve, the shifts were less significant, the 2-year Treasury decreased by 1 bps, the 10-year by 5 bps, and the 30 year by 1 bps. Despite larger yield changes at the front end of the curve, there was very little difference in the performance between different maturity points along the entire yield curve in April.
Real assets categories posted mixed results during April. Global REITs (+1.9%) were buoyed by European (+7.6%) and Asian (+2.4%) property stocks, which benefited from stable banking sectors and an improved economic outlook. Infrastructure stocks (+1.8%) benefited from their defensive cash flows and an expected pivot by the Federal Reserve. Natural resources equities advanced 1.8% as a result of positive earnings reports, International Energy Agency projections that crude demand will materially increase, and higher oil prices, which were driven by a surprise production cut of 1 million barrels per day by OPEC. Many domestic oil and gas producers are highly profitable at $70–80 per barrel and companies in the sector have largely remained focused on attempting to maximize returns and cash flows rather than increasing production.
Diversified commodities fell 1.1%, led by industrial metals (−3.4%), which often correlate with global economic sentiment over short timeframes. Clean energy stocks (−5.4%) fell on disappointing earnings reports from the solar sector and rising debt costs for homeowners looking to add solar to their homes.
Several important issues remained unresolved heading into May, including the potential conclusion of the Fed’s rate hike cycle, the possibility of more bank failures, the impact of tighter lending conditions on commercial real estate, the shift in consumer spending from goods to services, and the resilience of core services inflation.
Hedge funds and traditional long-only managers have increased liquidity in an effort to be defensive as a safeguard against market uncertainty and as a means of having dry powder as they seek to take advantage of opportunities as they emerge. We believe this is a prudent course of action as diversification and liquidity can help shield portfolios from unexpected events and may also provide a way to take advantage of attractive investment opportunities.