Perspectives
Investment Perspective: Where is Monetary Policy Going?
Mar 22, 2023
Back to all posts.Introduction
In March 2022, the Federal Reserve embarked on what was to become the fastest tightening cycle in a generation, increasing the federal funds rate (FFR) from 0.125% to 4.625% over a span of 12 months. Fed guidance calls for a terminal FFR of 5.125%—roughly two more 25 bps rate hikes. However, when new projections are released at the end of the Federal Open Market Committee’s (FOMC) March 21-22 meeting, it is possible that the terminal rate could be revised even higher. Conversely, recent developments in the banking sector could stoke fears of financial instability, which could cause the Fed to be on hold.
Whether there is one, two, or several more hikes, it is clear the tightening cycle is nearing its end. The logical next question is: how long before the Fed begins an easing cycle? A couple considerations:
- The Fed has guided for it to raise rates to restrictive territory and vaguely stated it will hold them there “for some time.”
- Futures traders were pricing in an easing cycle that begins sometime in mid-2023. However, after a strong nonfarm payroll report and higher CPI print, the expectation now is for easing to begin in early 2024.
In this Investment Perspective, we will examine the length of previous tightening and easing cycles. We will also share some observations on how public equity and fixed income markets have performed during past easing cycles.
Evolution of Monetary Policy
The chart below shows the FFR from March 1982 to February 2023.
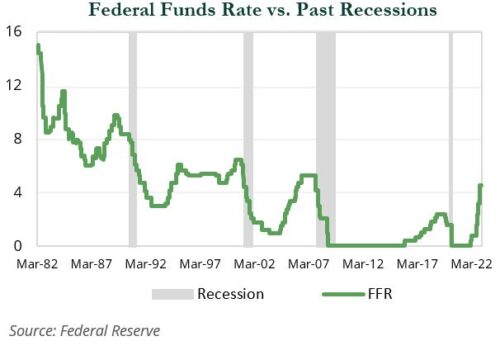
The Fed has used the FFR as the primary monetary policy tool since 1983. Therefore, we began our analysis as of that time frame. As shown in the chart above, there were eight peaks in the FFR since 1983, with several “mini peaks” during the latter part of Paul Volcker’s tenure as Fed chair (1979-87) .
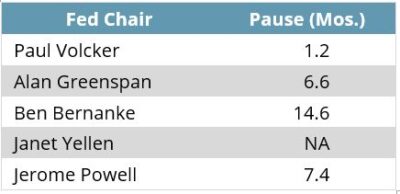
The average time between the last hike and the start of an easing cycle was 6.4 months. However, the data is somewhat skewed by the outliers, as Volcker was quick to change and Ben Bernanke was slow. The average increases to 9.5 months when Volcker’s tenure is removed and decreases to 5.0 months when Bernanke’s tenure is removed.
Janet Yellen hiked rates by 100 bps from 0.375% in December 2015 to 1.375% by the end of her tenure in February 2018. Jerome Powell hiked 100 bps to 2.375% by July 30, 2019 before the pause occurred.
Barring a deep downturn that would warrant a fast pivot, it seems that a 6-9 month pause after the terminal FFR is reached is a reasonable estimate.
The Fed is expected to hike rates at its March and May meetings, bringing the FFR up to 5.125%. There is a growing chance of another hike in June, which would raise the FFR to 5.375%. If this is the terminal rate and the Fed pauses by 6-9 months, then an easing cycle could potentially start during the first quarter of 2024.
Performance During Easing Cycles
We examined returns during the last six easing cycles. During easing cycles, fixed income markets generally performed well, while high yield was mixed. In particular, longer duration assets have tended to perform better than their short- to intermediate-duration counterparts.
Equity markets in the first three observations delivered positive returns, but were negative over the past three observations. However, we would warn against drawing causality from those observations, highlighting:
- 2001–03: There were two large bankruptcies, MCI and Enron.
- 2007–08: Lehman Brothers filed for bankruptcy a few months before the cycle ended.
- 2020-21: The COVID pandemic led to a sharp selloff in equities, which led to rates going back to the zero lower bound, followed by significant federal fiscal measures.
We examined the 12-month period following the end of the easing cycle.
The analysis shows equity market and high yield performance were strong once visibility into earnings and the business cycle improved. It is noteworthy that the curve tended to steepen over the following 12 months, especially over the past four easing cycles. This caused longer-duration, which outperformed during the easing cycle, to generally lag its short- to intermediate-term counterparts. Cash delivered positive absolute returns although the starting and ending yields had a significant impact on the magnitude of the returns.
Summary
The current tightening cycle appears to be coming to an end, and if history is a guide, investors should expect a pause sometime in late 2023 or early 2024. Longer duration fixed income assets have tended to do well during easing cycles, but public equity markets and high yield lagged for 1-3 months before a rally in risk assets began (March 2009 and April 2020). The rallies in risk assets were noteworthy once visibility improved.
We advocate investors build portfolios with enough flexibility to take advantage of opportunities as they emerge. Please reach out with any questions.