Global inflationary pressure and hawkish central banks were two pervasive and profound themes of 2022. Inflation proved to not be transitory and reached levels not seen in nearly four decades. As a result, central banks around the globe were forced to remove policy accommodation and tighten financial conditions to get inflation back to an acceptable level. The combination of high inflation and rising interest rates caused a sharp selloff in capital markets, from global equities to fixed income to real estate. Few investments delivered positive returns on the year, including cash, the U.S. dollar (USD), and select commodities such as energy and agriculture.
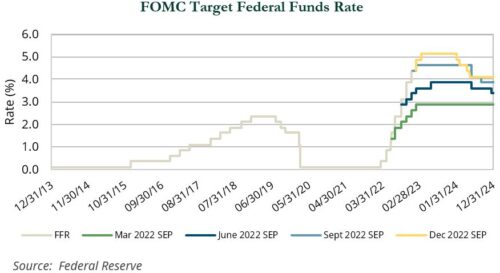
Interest rates were at or below the zero lower bound entering 2022. Outside of central banks in Japan, Turkey, and Russia, other developed and emerging market (EM) central banks pursued a tightening cycle. As inflation continued to surprise to the upside, many countries were forced to raise rates by a larger amount in order to control price increases. The U.S. Federal Reserve began its tightening cycle in March with a typical 25 bps hike but followed that up with a 50 bps hike in May. Over the next four consecutive meetings, the Fed hiked by a remarkable 75 bps each time before ending the year with a 50 bps hike. As shown in the chart below, the Fed prepared markets for a faster pace of tightening over the course of the year.
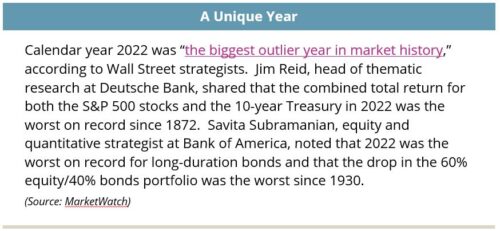
With interest rates as a key input into asset valuations, this aggressive tightening cycle had a profound impact on asset class returns. After starting the year at all-time highs, domestic equities entered bear market territory mid-year and ultimately had their worst calendar year since 2008. Even with a fourth quarter rebound, the Russell 3000 Index ended the year down 19.2%. Outside of surging outlier energy (+63.2%), sectors were broadly negative, albeit with significant dispersion. It was a particularly challenging year for growth relative to value, as Fed tightening weighed heavily on longer duration, more richly valued companies. The relative performance of the Russell 3000 Value Index (−8.0%) versus the Russell 3000 Growth Index (−29.0%) represented the second best calendar year for value since 1979.
Communication services (−40.8%) and consumer discretionary (−36.2%) were the worst performing sectors, followed by technology (−29.9%). Unlike the COVID-drive downturn in 2020, mega cap growth names did not provide downside protection during what proved to be one of the more challenging years in recent memory for passive management. Notable decliners among the largest index components were Tesla (−65.0%), Meta (−64.2%), Amazon (−49.6%), Alphabet (−39.1%), Microsoft (−28.0%), and Apple (−26.4%), and with each experiencing market cap declines of $600–850 billion. PayPal (−62.2%), Netflix (−51.1%), NVIDIA (−50.3%), and Meta also contributed to sizable losses for the broader indices and laggard sectors. Traditionally more defensive areas of the market such as utilities (+1.2%), consumer staples (−1.2%), and health care (−5.9%) protected well during a difficult year for equities.
U.S. small caps lagged their large cap counterparts; the Russell 2000 Index declined 20.4% versus 19.1% for the Russell 1000 Index. Small caps have lagged large caps in each of the past six calendar years and eight of the past nine years. The last time small caps lagged large caps so consistently was during the early and mid-stages of the dot-com boom in 1994–1998, which was followed by six consecutive years of small cap outperformance.
For the first time since 2017, developed non-U.S. equities, as measured by the MSCI EAFE Index (−14.5%), bested their domestic counterparts, aided a 17.3% rally by foreign equities in the fourth quarter. Out-performance for the year would have been greater if it were not for the strength of the USD. The EAFE Index fell just 7.0% in local currency terms, but—fueled by a hawkish fed—the USD rose significantly against the Japanese yen (−12.7%), British pound (−11.2%), and euro (−6.2%).
Sector returns abroad followed a similar pattern. Energy (+28.5%) defied broad market weakness, while traditional growth segments like technology (−32.2%) fell particularly hard. On the whole, the MSCI EAFE Index benefited from a relative lack of exposure to mega cap tech and ecommerce compared to the United States, as measured by the Russell 3000 Index. From a regional perspective, a number of markets exhibited resilience in the face of macro headwinds. For example, the U.K. closed the year up 7.1% in local terms despite rising inflation, political turmoil, and looming recession—bolstered by the strength of its many large, multinational companies.
Volatility remained elevated across EM equities (−20.1%) in the wake of a weakened global macroenvironment and troubling geopolitical headlines. Russia’s invasion of Ukraine in February roiled global equity markets before Russia’s stock market closed to foreign investors and the country was dropped by major global index providers. China (−21.9%) was the most significant headwind to EM performance against a backdrop of geopolitical uncertainty and self-inflicted wounds caused by regulatory crackdowns and a hardline zero-COVID policy. The fallout from nearly three years of draconian COVID containment measures began to emerge toward year-end as a slowdown in consumer spending and turmoil in the country’s real estate sector contributed to a pullback in GDP, which fell below target in the third quarter. Chinese stocks levered to growth and consumption were hit the hardest and contributed to the underperformance of growth (−24.0%) versus value (−15.8%) in emerging markets.
Latin America was a bright spot in emerging markets, buoyed by Brazil (+14.2%). Brazil benefited from rising commodity prices despite a controversial presidential election in which Former President Luis Inacio Lula da Silva, who was jailed on corruption charges after two terms (2003–10), defeated incumbent President Jair Bolsonaro in a run-off election.
Fixed income markets were heavily impacted by the Fed’s aggressive actions, particularly during the second half of the year. The three-month Treasury bill rose 436 bps to 4.4%, outpacing the 369 bps increase in the two-year Treasury note to 4.4% and the 237 bps increase in the 10-year Treasury to 3.9%.
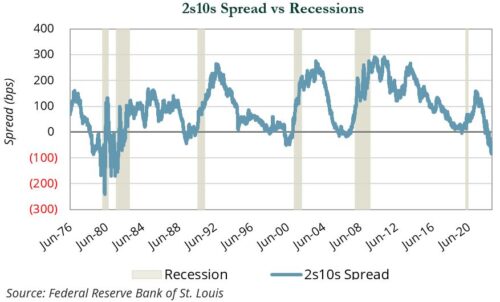
The change in yields led to a persistent inversion of the yield curve between 2- and 10-year Treasuries (“2s10s”) in the second half of the year. Historically, yield curve inversions have been a reliable signal of a future recession. The current inversion is the worst since the double-dip recessions of the early-80s.
In addition to rising rates, fixed income investors also had to contend with wider credit spreads. While fundamentals remain sound and default rates remain low by long-term historical standards, fear of a Fed-induced recession caused investors to demand higher compensation to invest outside of sovereign debt.
As a result of these changes, fixed income as an asset class produced the worst returns in a generation. Long-term debt, whether U.S. Treasuries or corporates, produced negative returns that exceeded broad equity market declines. The only positive area of fixed income were short-term Treasury bills, which rose 1.5%. Until the trough was reached in October, the Bloomberg U.S. Aggregate Index was in the midst of the worst drawdown in almost 50 years.
While broad equity and fixed income markets struggled, diversified real assets provided strong protection against the sharp market drawdown and persistently high inflation. Private real asset portfolios generally outperformed their public counterparts.
Traditional energy delivered the strongest performance, ranging from 34.1% (North American Natural Resources Index) to 65.7% (S&P energy sector) on the public side to 18.9% for private strategies (through September 2022). The war in Ukraine reshaped and de-globalized energy markets, resulting in significant volatility and higher prices for crude oil, refined products, and natural gas. Despite strong returns, profitability and fundamentals, new public energy equity issuance and private energy fundraising remained at record lows. This lack of capital investment may continue to constrain supply in 2023 and beyond.
Elsewhere in real assets, infrastructure significantly outperformed broader markets with public infrastructure equities declining 0.2% and private infrastructure gaining 4.9% (through September 2022). The segment benefited from strong growth in cash flows and earnings, as well as higher replacement costs. However, these factors were offset by investor concerns around higher interest rates, which impacted multiples, and the relative attractiveness of the sector’s income distributions. Clean energy and infrastructure continued to experience strong tailwinds driven by market demand for clean energy, decarbonization solutions, digital infrastructure, and net zero commitments by governments and corporations. These tailwinds may increase in strength with the passage and deployment of the Infrastructure Act of 2021 and the Inflation Reduction Act of 2022, the latter of which is centered on clean energy and traditional energy security.
Public REITs (−24.2%) were the only underperforming segment in real assets. The pace and magnitude of interest rate hikes, combined with concerns around a potential downturn’s impact on demand for multi-family and commercial space, caused investors to rotate capital to other areas. These factors overwhelmed cash flow growth, which continued to outpace inflation in many sectors. It is notable that secular tailwinds for residential, industrial, and other sectors remained intact and that REIT markets have tended to overshoot to the upside and the downside relative to private real estate.

Private real estate gained 3.9% (through September 2022) as strong cash flow growth slightly offset higher market capitalization rates (year one income/price) and higher debt costs. Some sectors of private real estate may be in store for markdowns in 2023, most notably office, which continues to experience high vacancy and shadow vacancy due to the adoption of hybrid work arrangements.
The hedge fund industry experienced wide dispersion across strategies in 2022. Macro and CTA strategies led the way, capitalizing on shifts in global interest rates and sustained trends in currencies, commodities, and equities during the year. Credit-oriented managers generally fared well, with many outperforming the broader high yield market due to a combination of strong credit selection, market hedges, and a lack of duration exposure in a rising rate environment.
Many credit specialists shifted their portfolios to be more liquid and conservative ahead of an expected uptick in distressed situations in 2023. Concurrently, less-liquid private credit strategies grew rapidly, in part to take advantage of future distress, but also to lean into opportunities in the lending space at higher interest rates. Long/short equity was mixed. Growth managers lagged, with many tech specialists experiencing their worst ever drawdowns. Managers running hybrid public-private strategies slowed their venture investing activity, and several were forced to contend with reduced liquidity as public positions lost value faster than privates were marked down. Conversely, it was a banner year for many value-oriented long/short managers that took advantage of the collapse in “innovation” stocks, former SPACs, and anything crypto-oriented to generate stellar alpha on the short side. Buyout markets were divided in two segments—an active first half of the year that was buoyed by strong exit activity carrying over from 2021 and a disappointing second half that was stalled in terms of deal activity, exits, and fundraising.
In private equity, the increased cost of capital prompted firms to either over-equitize transactions or take a “wait and see” approach, hoping that deal pricing normalizes. As the Fed focused on rate hikes, the cost of financing increased as well, causing buyers to reevaluate their return expectations versus their underwriting time horizon.
While total deal activity slowed in the year, investors were still committing capital to the venture segment, as $162 billion was raised by 769 funds, which surpassed the previous record of $150 billion in 2021. Venture IPO exit activity declined precipitously to $71.4 billion—the first time it fell under $100 billion in six years. Furthermore, acquisitions of venture-backed companies totaled $763 million in the fourth quarter, which is the lowest quarterly total in more than a decade. Concerns around valuations hampered the exit environment, as both buyers and sellers reset exit expectations. Investors can expect the slow exit environment to continue in the first half of 2023.
Amid this backdrop, the traditional 70/30 portfolio (70% domestic equities/30% fixed income) fell 16.3% in 2022 as the S&P 500 fell 18.1% and the Bloomberg Aggregate Index declined 13.0%. This mix lagged the 9.5% decline of a more broadly diversified portfolio, which incorporates non-U.S. developed and EM equities, private equity, real assets, hedge funds, and non-U.S. bonds. Diversified portfolios benefited from exposure to inflation-hedging categories such as natural resource
equities and commodities, which gained 34.1% and 16.1%, respectively. Exposures to private equity and hedge funds were also positive contributors on a relative basis. Headwinds to the diversified portfolio included EM equities, global real estate, and long-dated U.S. Treasuries, all of which fell more than 20% during 2022.
Outlook
To say 2022 was unusual would be an understatement, but that provides little comfort to investors. With the benefit of hindsight, it is clear that the Fed erred too cautiously in removing liquidity. Now there is some concern that the risk of another policy mistake—namely tightening too quickly and causing a recession—has become part of investor mindsets. As the economy slows and potentially enters a recession, credit default rates could surpass current expectations, which would lead to wider credit spreads and potential weakness in equity markets.
When uncertainty and fear become more present in markets, higher volatility normally follows. From 2010 to the start of the pandemic, equity volatility was fairly muted, aside from spikes related to the U.S. downgrade in 2011 to energy market-related concerns in 2015. Also, there is a disconnect between Fed guidance on how high policy rates will go (to 5.1%, based on the December Summary of Economic Projections) and where bond markets believe rates will peak (roughly 4.9%). As a result, investors should brace for higher periods of volatility that normally follows periods of contained volatility.
Volatility will present investors with opportunities. The 2022 downturn spared few asset classes; the silver lining in 2023 is that valuations are now more reasonable and longer-term expected returns improved across most asset classes. We continue to advocate for a diversified portfolio as a means to protect against uncertainty and note that with bonds yields far from the zero lower bound, it is reasonable to believe historical correlation relationships are in a better position to reassert themselves. Combined with the benefit of diversifying across private investments and lower starting multiples in public equity markets, we feel positive about how portfolios are positioned.
We remain steadfast in our resolve to work with each client to develop a plan that is intended to take advantage of opportunities as they arise and achieve long-term goals.