January was challenging for capital markets. Volatility grew as geopolitical risk concerning Russia’s potential invasion of Ukraine coincided with ongoing inflationary pressure and hawkish moves by the Federal Reserve. While market performance has historically benefited from past Fed tightening cycles, there is concern that a triple tightening threat—an imminent end to quantitative easing bond purchases, a rate hike, and a balance sheet normalization—could potentially end the expansion. The market in January was a prime example of how rising fears can lead to heightened risk aversion and hurt performance for most assets classes.
In our recent investment perspective, Market Volatility and the Fed Pivot, we outlined some important factors that led to volatility, including the sharp shift in monetary policy. As a follow-up to that report, we think it is important to examine performance following similar shifts in the past. As shown in the chart on the following page, performance immediately following the three previous tightening cycles, was mostly positive across asset classes, with some mixed performance from REITs and commodities and the U.S. dollar.
However, given the forward-looking nature of markets, it is instructive to look at asset class performance six months prior to the start of the tightening cycle. As the chart to the right indicates, the data is mixed with more negative returns in the six months prior to the start of the cycle. This is especially true for the most recent tightening cycle.
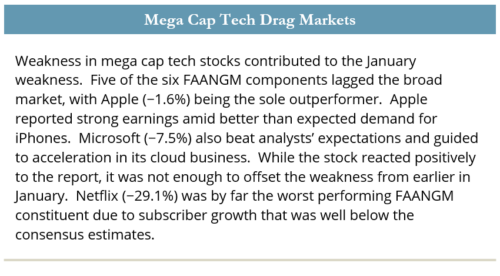
Negative performance was fueled at least in part by the pending tightening cycle, which could be more severe than expected given the elevated levels of inflation. The S&P 500 declined 5.2%, which was the worst month since the pandemic-related selloff in March 2020. The 5.9% drawdown for the broader Russell 3000 Index was even larger.
Energy (+17.3%) was the only sector within the Russell 3000 to finish January in positive territory. The second best performer, financials (−0.4%), lagged far behind, but held up relatively well due to higher interest rates. Defensive consumer staples (−1.8%) and utilities (−3.3%) sectors also finished ahead of the broad index in a risk-off environment. Consumer discretionary (−10.0%) was the worst performing sector amid double-digit drawdowns for Amazon (−10.3%) and Tesla (−11.4%). The once-surging real estate sector (−8.2%) followed closely behind.

Value stocks handily outperformed their growth counterparts; the Russell 3000 Value Index declined 2.6% versus an 8.9% drawdown for the Russell 3000 Growth Index. Meme stocks, such as AMC Entertainment (−41.0%) and Virgin Galactic (−31.2%), posted sharp declines amid a shift in retail investors’ sentiment. Goldman Sachs’ baskets of Liquid IPO (−22.3%) and Non-Profitable Tech (−19.4%) stocks also sold off, as did ARK’s Innovation ETF (−20.3%). All three would have posted even sharper losses if not for a short-covering rally during the last two trading days of the month.
In a risk-off market, small caps once again lagged large caps; the Russell 2000 Index declined 9.6% versus a 5.6% drawdown for the Russell 1000 Index. Small caps have now lagged large caps in 10 of the past 11 months. The underperformance of small cap tech and healthcare—particularly biotech—accounted for most of the shortfall in January and over the past 11 months.
The Fed’s response reflects its evolving view on inflation. Inflation was driven higher by a number of different and varied factors, particularly rising energy prices. Brent crude eclipsed $90 per barrel during the month, which is the highest level since 2014. Year-to-date prices have increased 14.8% and energy equities are up 19.1%, with energy one of only two S&P 500 sectors in positive territory. The crude market was already notably tight at the start of 2022 due to a combination of strengthening demand—which has been resilient to both the delta and omicron COVID-19 waves—and under-investment in supply. U.S. shale producers have been slow to ramp up production as investors are demanding companies focus on increasing dividends and reducing debt rather than growing production. Within OPEC+, some member countries, including Russia, have struggled to increase supply in line with their higher quotas due to a lack of investment over the trailing two years. Similar to equity markets, the recent price increase was driven primarily by geopolitical concerns in Ukraine/Russia and the Middle East.
Rising geopolitical tensions and risk aversion led to a flight to safety during the month. However, the Treasury market was more focused on Fed tightening and yields repriced higher. The sharpest moves in the yield curve were at the two-year and five-year tenors; two-year Treasuries rose 43 bps to 1.2% and five-year Treasury yields rose 35 bps to 1.3%. Not only do the rise in yields imply possibly five rate hikes in 2022, but the flattening of the curve (the two-ten spread fell 16 bps to 62 bps) reflects fears of a growth slowdown. As a result of these moves, longer-term U.S. Treasuries fell 4.1% in January and underperformed the 2.0% decline of intermediate-tenor Treasuries.
In addition to Treasuries posting negative returns, securitized assets also declined, falling 1.5%, with weakness in commercial mortgage-backed securities leading the decline. Credit spreads widened with a 14 bps increase in investment grade to 106 bps, and a 59 bps increase in high yield to 342 bps. Investment-grade corporates fell 3.4% and high yield bonds, which are often thought as being more resistant to rising rate pressures, fell 2.7%. The only two areas that protected capital were T-bills and leveraged loans, which returned 0.0% and 0.1%, respectively.