Equity markets shrugged off several lingering concerns during October, including disrupted supply chains, elevated inflation, and stalled global growth. Fears about growth seemed to intensify following weaker than expected third quarter GDP reports in the U.S. and Germany, as well as ongoing challenges in China. Markets also grappled with the prospect of less monetary policy support from global central banks. Expectations that the Federal Reserve would taper its quantitative easing (QE) programs in early November reverberated throughout the month, while both the Bank of Canada and the Bank of England abruptly ended their QE programs in October and several emerging markets (EM) central banks raised rates. Despite these concerns, corporate earnings continued to beat expectations, boosting U.S. equities to all-time highs. Inflation—specifically from rising energy prices and higher rents—caused a notable shift in U.S. breakeven rates. Inflation fears had a mixed impact on fixed income markets and caused some divergence in spread sectors.
The sharp market rally during the month more than offset weakness from September as the Russell 3000 Index appreciated 6.8%. During October the Russell 3000 Growth Index (+8.4%) outpaced the Russell 3000 Value Index (+5.0%) with growth pulling slightly ahead of value year-to-date.
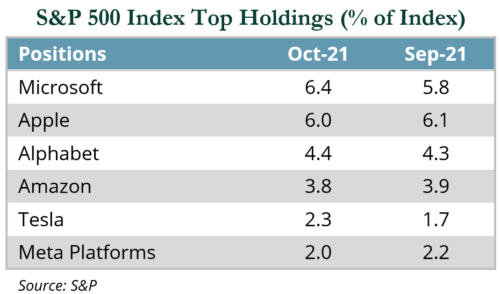
All 11 S&P 500 GICS sectors were up for the month; only communication services (+2.8%) and the more defensively positioned consumer staples (+3.9%) and utilities (+4.7%) sectors posted gains below 5.0%. The rallies in consumer discretionary (+10.9%) and energy (+10.4%) reached double digits, while technology (+8.2%) and financials (+7.3%) also gained notably in key sectors. Tesla (+43.7%) contributed more than 60 bps to the Index alone—second only to Microsoft (+17.6%), which contributed nearly 100 bps. Microsoft regained its position as the largest company by market cap, surpassing Apple (+5.9%). Alphabet (+10.7%) was another mega cap name that meaningfully impacted performance. The newly named Meta Platforms (−4.7%), formerly known as Facebook, struggled in the wake of statements by a whistleblower indicating the company put profit before safety.
 For the seventh time in eight months, small caps trailed their large cap counterparts with the Russell 1000 Index (+6.9%) exceeding the Russell 2000 Index (+4.3%). The healthcare and consumer discretionary sectors represented more than 70% of the gap between the indices during October. The healthcare sector was dragged down by biotech weakness, which makes up a significantly larger portion of the Russell 2000 Index. Within consumer discretionary, Tesla’s strong gains helped lift large caps over small caps. Tesla surpassed Facebook to become the fifth largest U.S. company by market cap—despite only being added as an S&P 500 constituent in December 2020.
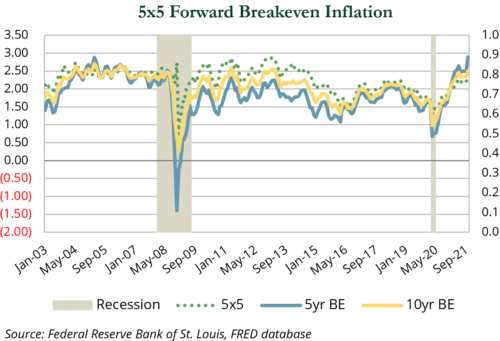
During the month, investors questioned the Federal Reserve’s use of the word “transitory” to describe inflation. While some categories have clearly moderated (used vehicle prices, airline fares, etc.), oil prices spiked and rental rates—which will eventually feed into the “owner’s equivalent rent” category of CPI—continued to rise rapidly. This caused an interesting move in breakeven inflation, imputed by the difference between the real yield on TIPS and the nominal yield on Treasuries. The five-year breakeven pierced 3.0% late in the month before moderating to 2.9% at month-end. These moves were the highest levels over the history of five-year U.S. TIPS.
While not fully reflected in the latest CPI print, higher prices continued to permeate across sectors and the broader economy. Two areas that have seen the largest jump in prices are housing and energy. Rents across the U.S. multi-family sector continued to increase (+11.6% YTD) due to an undersupply of single and multi-family homes. Restrictive zoning and a lack of skilled builders are ongoing drivers of the undersupplied market, which has been exacerbated by higher costs and lower supply of materials in recent months. A Realtor.com report estimated the U.S. housing shortage to be 5.2 million units, which is likely to only increase as millennials reach their peak household formation rates in the next couple of years. While Sunbelt and growing secondary markets saw sharp increases in rental rates during 2020, virtually all markets have participated in 2021, including major markets hit hardest by the COVID-19 pandemic such as San Francisco and New York.

Within energy, crude oil prices rallied 11.4% in October, bringing YTD gains to 72.2%. Energy equities followed suit for the month (+10.4%) and YTD (+58.1%). The combination of robust demand and constrained supply continued to drive prices higher, while global demand for gasoline, diesel, and manufactured goods that require refined crude products (clothing, plastics, medical supplies) continued to increase. Further, record high natural gas and coal prices caused some power producers to switch to lower-cost oil as an alternative. Crude demand is now forecasted to eclipse 2019 levels by mid-2022—a milestone that seemed highly unlikely six months ago.
On the supply side the Organization of the Petroleum Exporting Countries (OPEC) continued to hold back approximately 5.8 million barrels per day despite monthly increases in production quotas, while U.S. producers have limited production. Overall the sector continues to have very limited access to capital as some investors have left the space due to climate concerns while those that remain demand companies increase dividends rather than invest new production.
Clean energy stocks, as measured by the S&P Global Clean Energy Index, rallied 16.5%. The advance was driven by a combination of strong revenue and earnings growth as well as expansion announcements or higher growth expectations by some of the larger Index constituents. The potential passage of an infrastructure bill also pushed the sector higher, notably solar-related stocks, which would benefit from extended and increased subsidies.

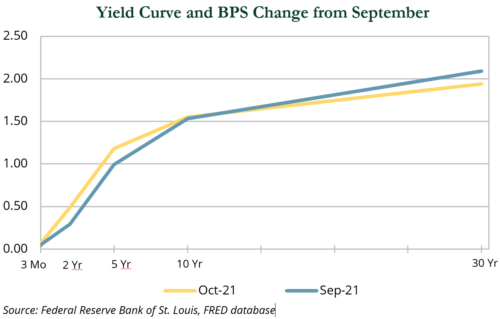
Despite elevated inflation expectations, changes in yields—and the shape of the yield curve—were mixed. There was a 2 bps increase in front-end yields and in the 10-year Treasury. However, the 30-year Treasury fell 15 bps. Most of the pressure on yields were in the two- and five-year Treasuries, which rose 20 bps and 19 bps, respectively. In aggregate, the curve flattened but there was a twist in the belly of the curve. As a result, Treasuries maturing in the next one to three years declined 0.3%, while those maturing in five to 10 years fell 0.7%, and the segment maturing in 10+ years rose 1.9%.
In contrast to September, spread sectors were mixed. Investment-grade corporates rose a modest 0.2% and bested the flat return of leveraged loans and the 0.2% decline of high yield. Investment-grade corporates have a longer duration profile than high yield and leveraged loans and started the month at tighter spreads relative to history.