Market Updates
March 2024 Monthly Market Review
 Domestic equity markets saw their fifth consecutive month of gains, with the S&P 500 and Russell 3000 indices each up by 3.2%. NVIDIA led domestic equity gains with a 14.2% increase, but overall, sectors like consumer discretionary and IT underperformed, influenced by declines in Apple and Tesla.
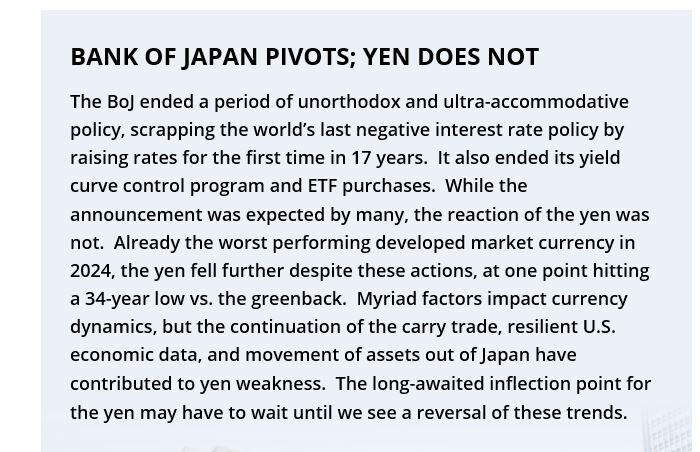
In contrast, the energy, utilities, and materials sectors excelled due to investor rotation towards real assets. Despite a robust year-to-date market performance, S&P 500 earnings growth expectations were revised downward. Internationally, developed and emerging markets also enjoyed gains, with notable performance in tech sectors due to rising AI demand. The Bank of Japan ended its long-standing negative interest rate and yield curve control policies, causing significant currency dynamics.
Fixed income remained steady, while real assets, especially in the energy sector, benefited from higher oil prices and geopolitical tensions, contributing positively to market dynamics.
 Global Equities
Domestic equity markets posted their fifth consecutive month of positive performance, with the S&P 500 and broader Russell 3000 indices gaining 3.2% in March. NVIDIA was the largest individual contributor to performance, extending its historic run with a 14.2% gain. However, the “Magnificent 7” stocks as a group lagged the broad market, dragged down by sell-offs in Apple (−5.1%) and Tesla (−12.9%).
As a result, the consumer discretionary (+0.8%) and IT (+1.6%) sectors were the two worst performing sectors. Instead, investors rotated into real asset sectors; energy (+10.5%) was by far the best performer for the month, followed by utilities (+6.9%) and materials (+6.4%). For the month, U.S. value stocks outpaced their growth counterparts by roughly 320 bps; however, growth remained ahead by 260 bps year-to-date (YTD).
The strong YTD market was at odds with corporate earnings revisions. Over the first three months of the year, the expected S&P 500 earnings growth ticked down from 11.5% to 10.6%. With prices up and projected earnings down, the forward P/E for the S&P 500 expanded from 19.7x to 21.0x.
Markets abroad enjoyed similar success. Like their U.S. counterparts, developed non-U.S. equities notched a fifth consecutive monthly gain, gaining 3.2%. Euro area countries (+4.1%) fared the best during the month, but it was Japan (+3.0%) that stole headlines as the Bank of Japan (BoJ) announced an end to its controversial negative interest rate and yield curve control policies.
Emerging markets (+2.5%) continued their momentum from February, buoyed by tech-heavy markets such as Taiwan (+7.9%) and South Korea (+5.2), which benefited from rising AI-related demand. While much of the direct AI design and consumption are levered to developed markets, the technology is heavily reliant on hardware and other inputs such as logic and memory chips produced by EM companies. Some of these higher profile companies include Taiwan Semiconductor (+12.1%) and Samsung Electronics (+11.4%), which have grown to represent the largest individual positions within the MSCI EM Index and are widely held by active EM equity managers. China (+0.9%) was modestly positive on signs of economic improvements, including better than expected manufacturing activity and continued incremental government policy support, particularly aimed at the battered property sector. Brazil (−1.8%) cooled off on fears of a return to heightened government influence over some of its large state-owned businesses and a reversal of privatization efforts under the previous administration.
Fixed Income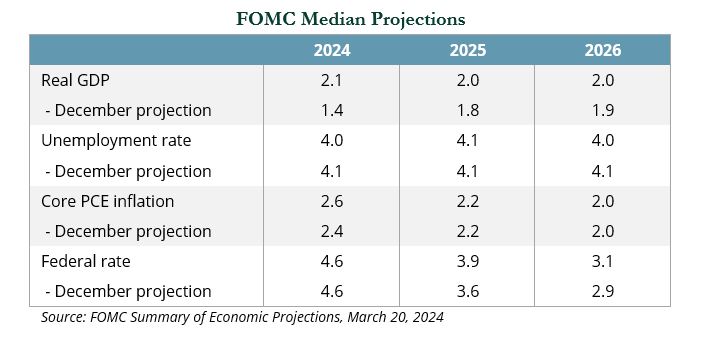
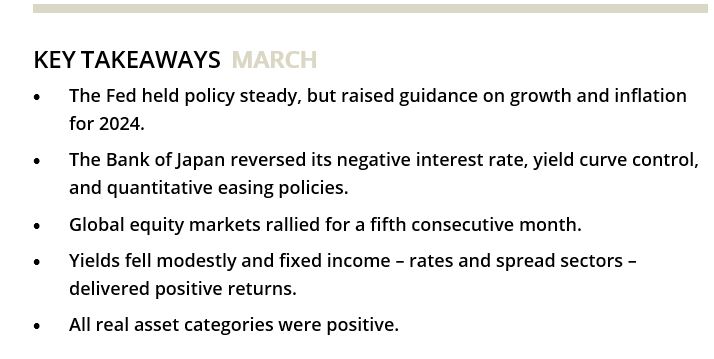
The Federal Reserve held policy steady at its March meeting, with no changes to interest rates or to the run-off of the balance sheet. In its Summary of Economic Projections, the Fed raised its GDP and inflation forecast and continued to guide for a strong labor market. The Federal Open Market Committee dot plot continued to project up to three rate cuts in 2024. While markets agree with this assessment, the prospects of stronger growth, stickier inflation, and an overall resilient economy suggest it is possible the Fed may not need to ease policy this year. The Fed lowered its guidance for rate cuts in 2025 and 2026.
Treasury yields modestly fell by a few basis points and the curve flattened by a small amount. As a result, longer duration strategies outperformed their shorter-dated counterparts. Long-term Treasuries increased 1.2% and outperformed the 0.7% return of intermediate-term Treasuries and the 0.5% gain in Treasury bills. In aggregate, the Treasury market rose 0.6%.
Credit spreads narrowed with high yield falling 13 bps and investment-grade corporates declining 6 bps. Securitized markets—both agency mortgage-backed securities (MBS) and areas of credit like commercial MBS (CMBS) and asset backed securities (ABS)—experienced tighter spreads as well.
High yield corporates returned 1.2% and investment grade rose 1.3%. Within securitized, the longer duration of agency MBS helped it rise 1.1%, outperforming the 0.9% gain in CMBS and the 0.5% rise in ABS.
Real Assets
Real asset categories were generally positive in March, with natural resource equities (+10.5%) leading the way on increased oil prices. Brent crude reached $87/barrel by month-end, up 6.2%. The price increase was driven by resilient demand as well as continued production cuts from OPEC, tightening U.S. sanctions on Russian oil exports, recent Ukrainian drone strikes on Russian refineries, and continued Houthi attacks on shipping vessels in the Red Sea.
Increased manufacturing activity in China also led to expectations of greater oil demand in the coming months.
Global REITs gained 3.4% on the month. European REITs (+8.4%) and UK REITs (+7.8%) outperformed with expectations that the European Central Bank and Bank of England (BOE) could begin to lower rates ahead of the Fed. U.S. REITs (+1.9%) ticked higher on stabile yields and expectations for rate cuts in 2024.
A resilient economy and consumer were positives for space demand, with regional malls (+6.8%) and apartments (+6.1%) offsetting losses in data centers (−5.0%) and industrial REITs (−0.5%).
Commodities (+3.3%) were buoyed by increased gold prices (+8.4%), which reached an all-time
high on elevated geopolitical risks, expected rate cuts, and significant central bank purchases. Precious metal commodities, which consists primarily of gold, increased 8.6%. ⬛
Indices referenced are unmanaged and cannot be invested in directly. Index returns do not reflect any investment management fees or transaction expenses. Copyright MSCI 2024. Unpublished. All Rights Reserved. This information may only be used for your internal use, may not be reproduced or redisseminated in any form and may not be used to create any financial instruments or products or any indices. This information is provided on an “as is” basis and the user of this information assumes the entire risk of any use it may make or permit to be made of this information. Neither MSCI, any of its affiliates or any other person involved in or related to compiling, computing or creating this information makes any express or implied warranties or representations with respect to such information or the results to be obtained by the use thereof, and MSCI, its affiliates and each such other person hereby expressly disclaim all warranties (including, without limitation, all warranties of originality, accuracy, completeness, timeliness, non-infringement, merchantability and fitness for a particular purpose) with respect to this information. Without limiting any of the foregoing, in no event shall MSCI, any of its affiliates or any other person involved in or related to compiling, computing or creating this information have any liability for any direct, indirect, special, incidental, punitive, consequential or any other damages (including, without limitation, lost profits) even if notified of, or if it might otherwise have anticipated, the possibility of such damages. Bloomberg Index Services Limited. BLOOMBERG® is a trademark and service mark of Bloomberg Finance L.P. and its affiliates (collectively “Bloomberg”). Bloomberg or Bloomberg’s licensors own all proprietary rights in the Bloomberg Indices. Bloomberg does not approve or endorse this material, or guarantee the accuracy or completeness of any information herein, or make any warranty, express or implied, as to the results to be obtained therefrom and, to the maximum extent allowed by law, it shall not have any liability or responsibility for injury or damages arising in connection therewith. Copyright ©2024, S&P Global Market Intelligence (and its affiliates, as applicable). Reproduction of any information, data or material, including ratings (“Content”) in any form is prohibited except with the prior written permission of the relevant party. Such party, its affiliates and suppliers (“Content Providers”) do not guarantee the accuracy, adequacy, completeness, timeliness or availability of any Content and are not responsible for any errors or omissions (negligent or otherwise), regardless of the cause, or for the results obtained from the use of such Content. In no event shall Content Providers be liable for any damages, costs, expenses, legal fees, or losses (including lost income or lost profit and opportunity costs) in connection with any use of the Content. A reference to a particular investment or security, a rating or any observation concerning an investment that is part of the Content is not a recommendation to buy, sell or hold such investment or security, does not address the suitability of an investment or security and should not be relied on as investment advice. Credit ratings are statements of opinions and are not statements of fact. FTSE International Limited (“FTSE”) © FTSE 2023. FTSE® is a trade mark of the London Stock Exchange Group companies and is used by FTSE under license. All rights in the FTSE indices and / or FTSE ratings vest in FTSE and/or its licensors. Neither FTSE nor its licensors accept any liability for any errors or omissions in the FTSE indices and / or FTSE ratings or underlying data. No further distribution of FTSE Data is permitted without FTSE’s express written consent. Indices referenced are unmanaged and cannot be invested in directly. All commentary contained within is the opinion of Prime Buchholz and is intended for informational purposes only; it does not constitute an offer, nor does it invite anyone to make an offer, to buy or sell securities. The content of this report is current as of the date indicated and is subject to change without notice. It does not take into account the specific investment objectives, financial situations, or needs of individual or institutional investors. Some statements in this report that are not historical facts are forward-looking statements based on current expectations of future events and are subject to risks and uncertainties that could cause actual results to differ materially from those expressed or implied by such statements. Information obtained from third-party sources is believed to be reliable; however, the accuracy of the data is not guaranteed and may not have been independently verified. Performance returns are provided by third-party data sources. Past performance is not an indication of future results.
Research Report Request
To request a full copy of this or any of our research reports, please complete all fields in the form and click submit.